
2. Build revenue and operating costs
Outcome: forecast units, price, margins and cash operating expenses through one set of selected assumptions. Prerequisite: lesson 1.
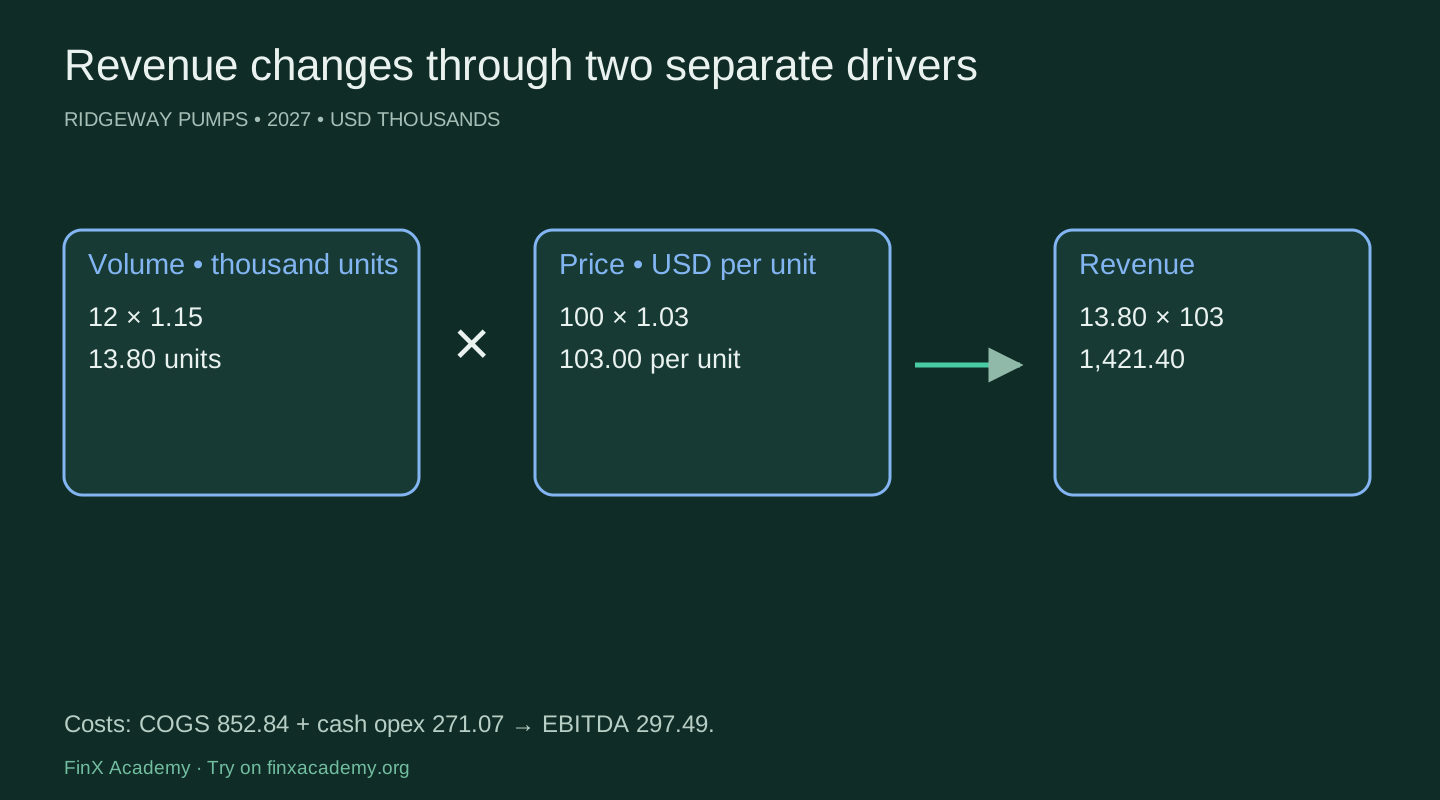
Before changing the workbook, predict whether 15% more pumps and 3% higher prices produce 18% revenue growth. The exact answer includes the interaction: 1.15 × 1.03 − 1 = 18.45%. A price-volume build exposes this mechanism.
Volume rolls from 12 to 13.8 thousand pumps. Price rolls from 100 to 103 dollars. Revenue is 13.8 × 103 = 1,421.40 in USD thousands. Do not divide by a thousand again: the volume already uses thousands. COGS at 60% is 852.84, leaving gross profit of 568.56. Fixed cash opex of 200 plus variable opex of 5% of revenue gives 271.07. EBITDA is 297.49.
| Step | Formula meaning | 2027 base |
|---|---|---|
| Volume | Prior volume × (1 + volume growth) | 13.80 |
| Price | Prior price × (1 + price growth) | 103.00 |
| Revenue | Volume × price | 1,421.40 |
| Cash opex | Fixed opex + revenue × variable share | 271.07 |
| EBITDA | Revenue − COGS − cash opex | 297.49 |
Margin and expense drivers describe different economics. A COGS share is a simplification for materials and conversion cost. Fixed opex has its own budget; it should not automatically scale with revenue. Depreciation and amortization are outside this cash-opex input and join the income statement from Assets. Keeping them separate prevents a double charge.
The selected scenario supplies every period's active assumptions. Change the selector once and watch the same formulas recalculate. Change only the 2027 price-growth input from 3% to 4% for a sensitivity, then restore it. Revenue becomes 1,435.20, a rise of 13.80; with unchanged cost shares EBITDA rises 4.83. Later years compound from the changed price, so the effect continues.
A realistic forecast also needs capacity, demand, product mix, seasonality and cost inflation evidence. This annual single-product case assumes capacity is sufficient and all recognized sales are collectable. Those assumptions require review. Do not interpret the model's five-year horizon as a five-year forecast confidence interval.
Practice: build the first year, fill across, switch to Downside and restore Base. Explain why a price increase changes more than revenue.
Hints: link the active driver, keep growth rates as percentages, and test the next year's opening volume. Checkpoint: EBITDA 297.49 precedes the asset, interest and tax charges.