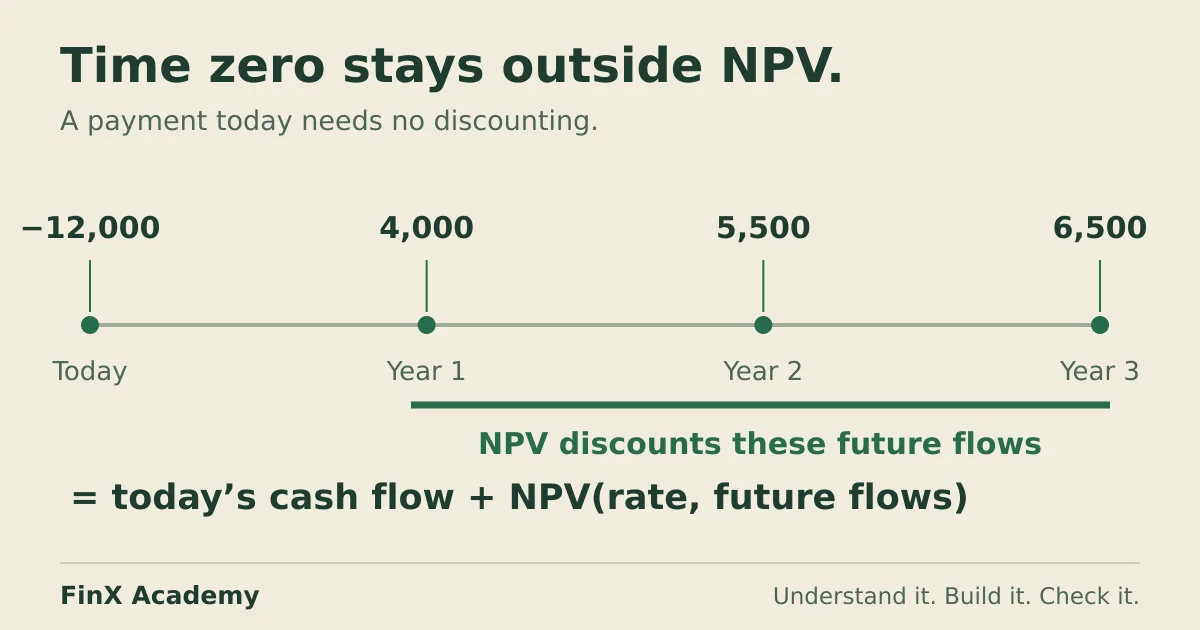
Excel's NPV discounts its first value by one full period, so a payment made today belongs outside the function. Check the result against a manual discounting schedule before deciding.
Net present value discounts every future cash flow back to today and nets them against what you pay now. In Excel the whole calculation is one function plus one addition:
=today's flow + NPV(rate, future flows)That split is the part people get wrong. Excel’s NPV function discounts its first value by one full period, so an investment paid today must sit outside the function’s range. Put it inside and every number in your answer belongs one period later than it should — quietly, with no error message. This article builds a small project schedule, proves the answer by hand, reproduces both classic timing mistakes, and compares the periodic function with its dated cousin, XNPV.
Set up the project schedule
Use a blank worksheet. A fictional company is evaluating a project in whole dollars. Put Annual discount rate in A1 and 0.10 in B1 — the company’s required return, also called the hurdle rate. Enter the schedule headers in row 3 and the cash flows in rows 4–7:
| Row | A: Period | B: Cash flow ($) |
|---|---|---|
| 4 | 0 | −12,000 |
| 5 | 1 | 4,000 |
| 6 | 2 | 5,500 |
| 7 | 3 | 6,500 |
Period 0 is today: the project costs 12,000 immediately, entered as a negative number because it leaves the company. The inflows arrive at the end of years 1–3, positive because they come in. Keep the sign convention consistent — outflows negative, inflows positive — and keep periods equally spaced, because both assumptions are baked into the NPV function. The rate must match the period: monthly flows need a monthly rate.
Discount each flow by hand first
Before using the function, build its answer manually. Put Present value ($) in C3, then this formula in C4 and copy it down to C7:
=B4/(1+$B$1)^A4Each flow is divided by (1 + rate) raised to the power of its own period. Put Total in A8 and =SUM(C4:C7) in C8. The results:
| Cell | Period | Cash flow | Present value |
|---|---|---|---|
C4 |
0 | −12,000 | −12,000.00 |
C5 |
1 | 4,000 | 3,636.36 |
C6 |
2 | 5,500 | 4,545.45 |
C7 |
3 | 6,500 | 4,883.55 |
C8 |
1,065.36 |
Today’s payment is not discounted — its exponent is 0 — while each later inflow shrinks by another factor of 1.10. The project’s NPV is 1,065.36: after paying 12,000 today, the discounted inflows are worth 1,065.36 more than that. Because the NPV is positive at a 10% hurdle rate, the project clears it.
Keep this schedule. It is the ground truth that catches every mistake below.
Get the same number from the NPV function
Put NPV (time zero outside) in A10 and this formula in B10:
=B4+NPV($B$1,B5:B7)The result is 1,065.36, exactly the manual total. Microsoft’s NPV documentation places the valuation date one period before the first cash flow supplied to the function. A payment on the valuation date must therefore be added separately. The range B5:B7 holds only the end-of-period inflows — NPV discounts 4,000 by one year, 5,500 by two and 6,500 by three — and B4, today’s −12,000, is added undiscounted.
Two time-zero mistakes
Put Mistake: time zero inside NPV in A11 and this formula in B11:
=NPV($B$1,B4:B7)The range now starts at today’s payment. The result is 968.51 — still positive, still plausible, and wrong. NPV treats −12,000 as arriving one year from now and pushes every other flow a year later too. Put Check: correct NPV ÷ (1 + rate) in A12 and =B10/(1+$B$1) in B12: the result is 968.51, the same number. That identity shows exactly what the mistake does — including the time-zero flow inside the function discounts the entire answer by one extra period. The sign survives here, but the value no longer matches the schedule, the dated XNPV below, or any reviewer’s hand check.
The second mistake is worse. Put Mistake: time zero counted twice in A13 and =B4+NPV($B$1,B4:B7) in B13. This adds today’s payment outside the function while also leaving it inside the range. The result is −11,031.49: a positive NPV becomes negative, reversing the screening result under the stated assumptions. The calculation does not by itself establish whether the forecast, discount rate or project is appropriate.
The rule that prevents both: the time-zero flow appears exactly once, outside the function. B10 agrees with the manual total in C8; that agreement is the check.
A cleared cell silently shifts flows
One more range hazard worth seeing once. Temporarily clear B6 — the year-2 inflow of 5,500 — and watch B10. Microsoft’s documentation notes that empty cells inside a reference are ignored, not treated as zero. NPV now discounts 4,000 for one year and 6,500 for two: the future flows’ present value falls to 9,008.26, and B10 becomes −2,991.74. Two things changed: the 5,500 inflow disappeared, and the remaining 6,500 was pulled one period earlier.
A cleared cell is not the same as a zero cash flow. Enter 0 in B6 and B10 becomes −3,480.09: the 6,500 stays in year 3. The blank-cell version overstates this zero-flow scenario by 488.35 because it discounts that last inflow for one year less. Use an explicit zero for a genuine no-flow period. Restore B6 to 5,500 and confirm B10 returns to 1,065.36 before continuing.
Dated flows: compare with XNPV
The NPV function needs equally spaced, end-of-period flows. Real payment schedules have dates, and that is what XNPV is for. Enter real dates with the DATE function — headers in row 19, data in rows 20–23:
| Row | A: Date | B: Cash flow ($) |
|---|---|---|
| 20 | =DATE(2026,1,1) |
−12,000 |
| 21 | =DATE(2027,1,1) |
4,000 |
| 22 | =DATE(2028,1,1) |
5,500 |
| 23 | =DATE(2029,1,1) |
6,500 |
Put XNPV in A25 and this formula in B25:
=XNPV($B$1,B20:B23,A20:A23)The result is 1,064.09. XNPV anchors on the first date — today’s payment is discounted by zero days, so no separate addition is needed — and discounts every later flow by its actual day count on a 365-day year. The 1.27 difference from the periodic 1,065.36 is the calendar: the last payment is 1,096 days after the initial investment, because 2028 is a leap year, slightly more than three exact 365-day years.
Now change A22 to =DATE(2028,7,1): the year-2 payment arrives six months late. B25 falls to 853.12. The periodic NPV function cannot express this delay at all — equal spacing is its core assumption — which is the practical reason CFI and Microsoft’s own function-selection guide recommend the dated functions for real schedules. Microsoft’s XNPV documentation also requires the series to contain at least one positive and one negative value. Restore A22 to =DATE(2028,1,1) afterwards.
IRR uses the same range differently
The internal rate of return is the discount rate at which the project’s NPV is exactly zero. Put IRR of the same flows in A27 and =IRR(B4:B7) in B27. The result is 14.59% — above the 10% hurdle, consistent with the positive NPV.
Note the range: IRR takes all four flows including time zero, because IRR solves for the return across the complete series, while NPV discounts its first supplied value for one period. Check the relationship in A28 with Check: NPV at the IRR and =B4+NPV(B27,B5:B7) in B28: the result displays as 0.00. A material difference calls for checking ranges, timing and convergence; a tiny residual can be numerical precision. Agreement confirms consistency between the formulas, not the accuracy of the underlying forecast.
Make the timing convention a checked habit
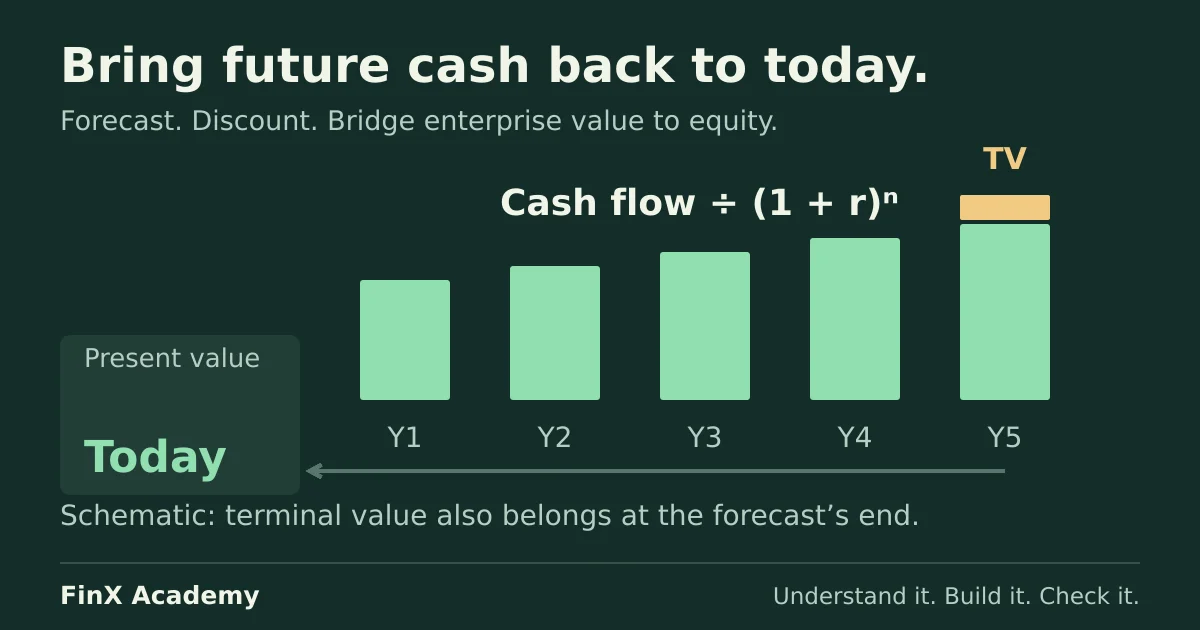
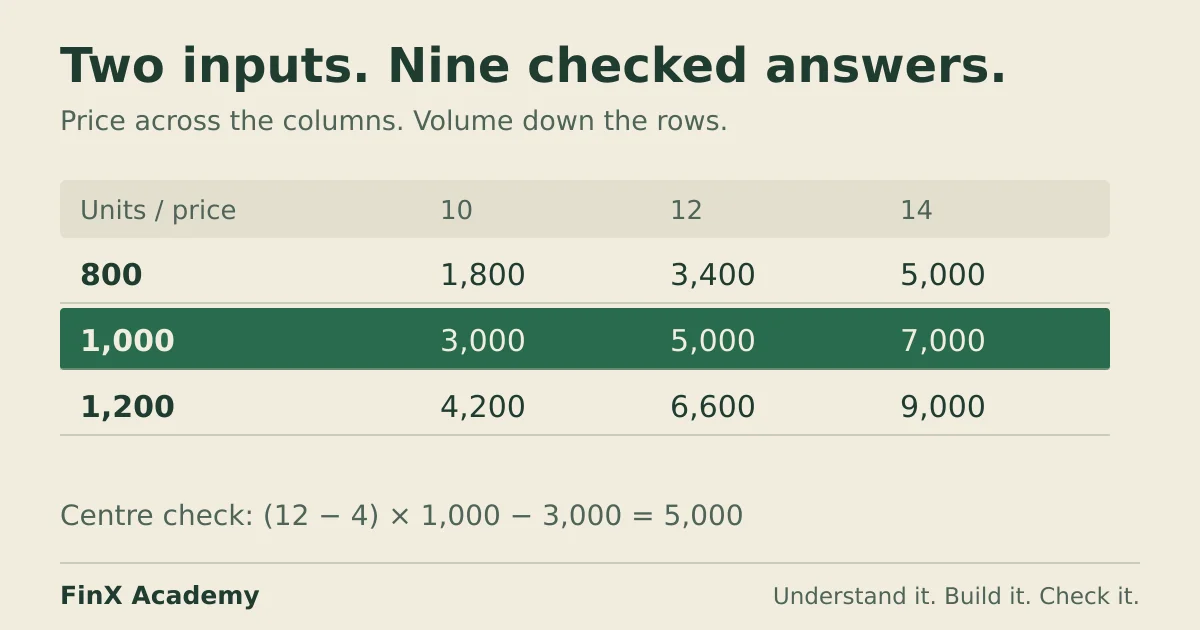
An NPV summarises a forecast under a discount-rate and timing assumption: match the rate to the period, count time zero once outside the function, enter explicit zero-flow periods and use dates when timing is irregular. Reconcile the manual column and the NPV-at-IRR check, then verify the inputs against the actual schedule. Where the rate is uncertain, use a discount-rate grid as shown in the sensitivity analysis guide. The DCF model shows how a full valuation matches cash flow to its discount rate and discounts a terminal value to the same valuation date.
For more practice with financial functions in context, see the Excel for finance guide and its course catalogue, or take the free five-question modeling test — five questions in ten minutes, not a graded workbook — to find the next skill to practise.
Continue with guided practice
Build on this guide with spreadsheet exercises on formulas, lookups and financial functions. Explore the syllabus and start with a free lesson.
Excel for Finance course