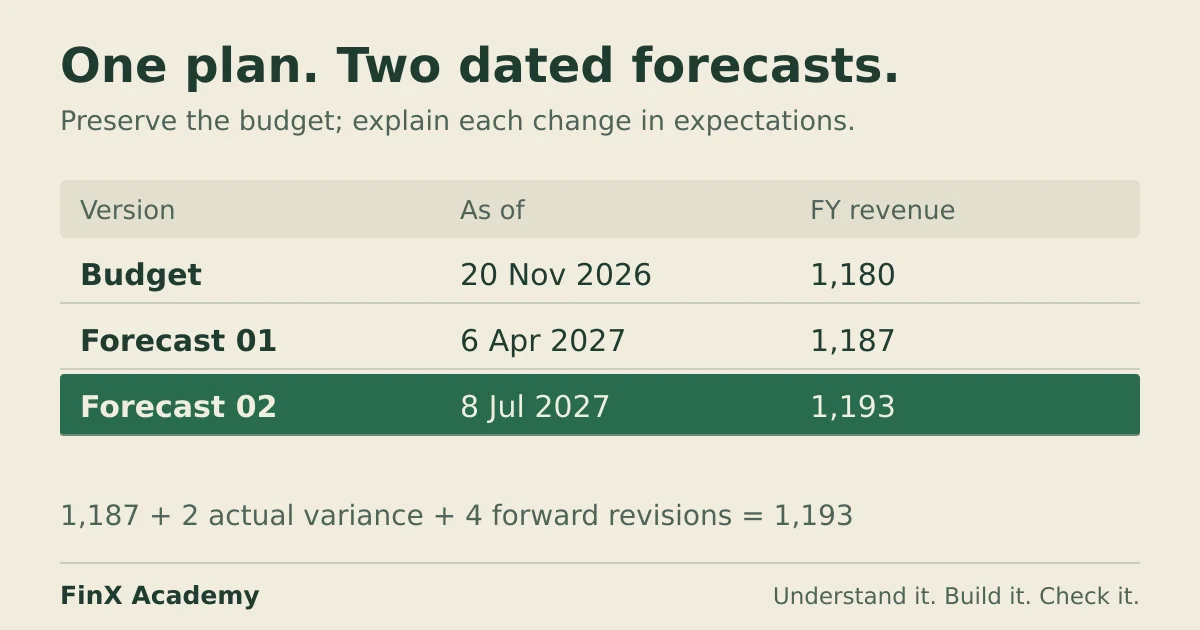
Budget vs forecast: update expectations without rewriting the plan
Learn the difference between a budget and a forecast with a dated monthly case: a variance bridge, two forecast versions and the annualising trap.
 Finx Academy
Learn the difference between a budget and a forecast with a dated monthly case: a variance bridge, two forecast versions and the annualising trap.
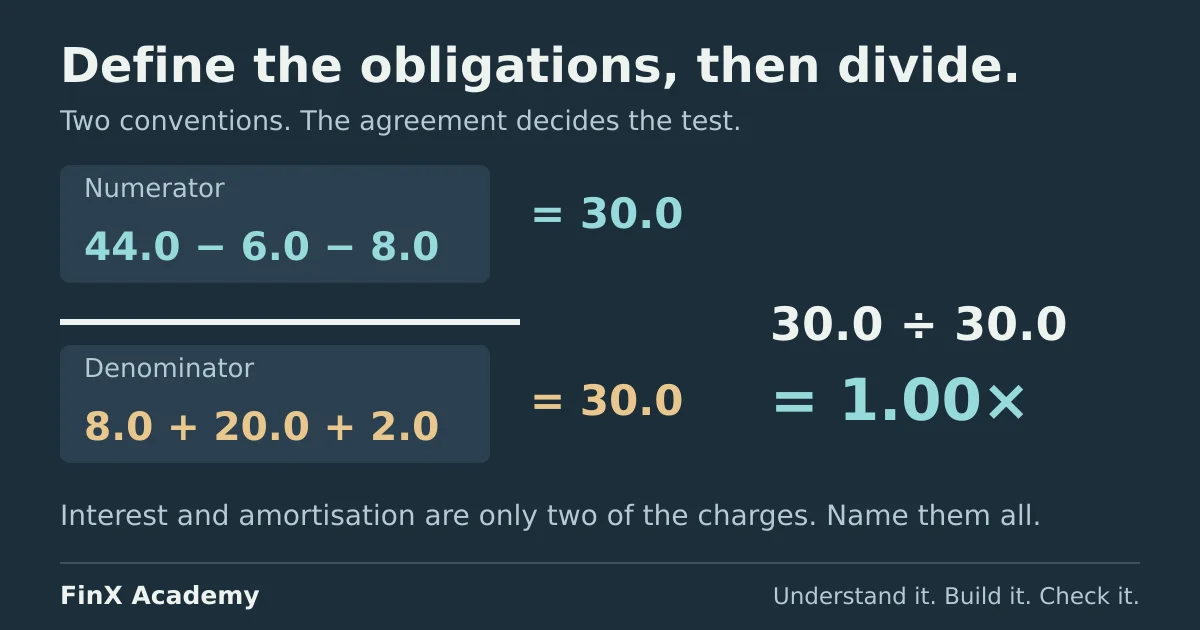
Calculate fixed-charge coverage under two stated conventions, reconcile debt service, and test a fictional covenant without double-counting lease payments.
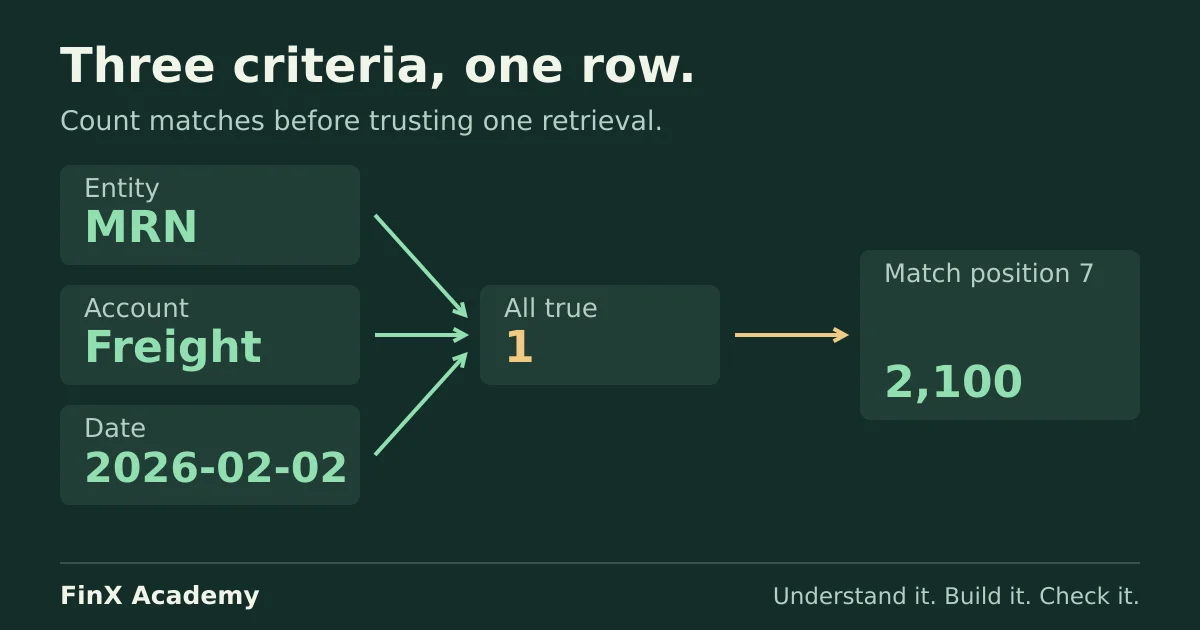
Practise INDEX MATCH on a fictional ledger: entity, account and date criteria, a duplicate combination, a missing one and a text-stored date — with worked answers.
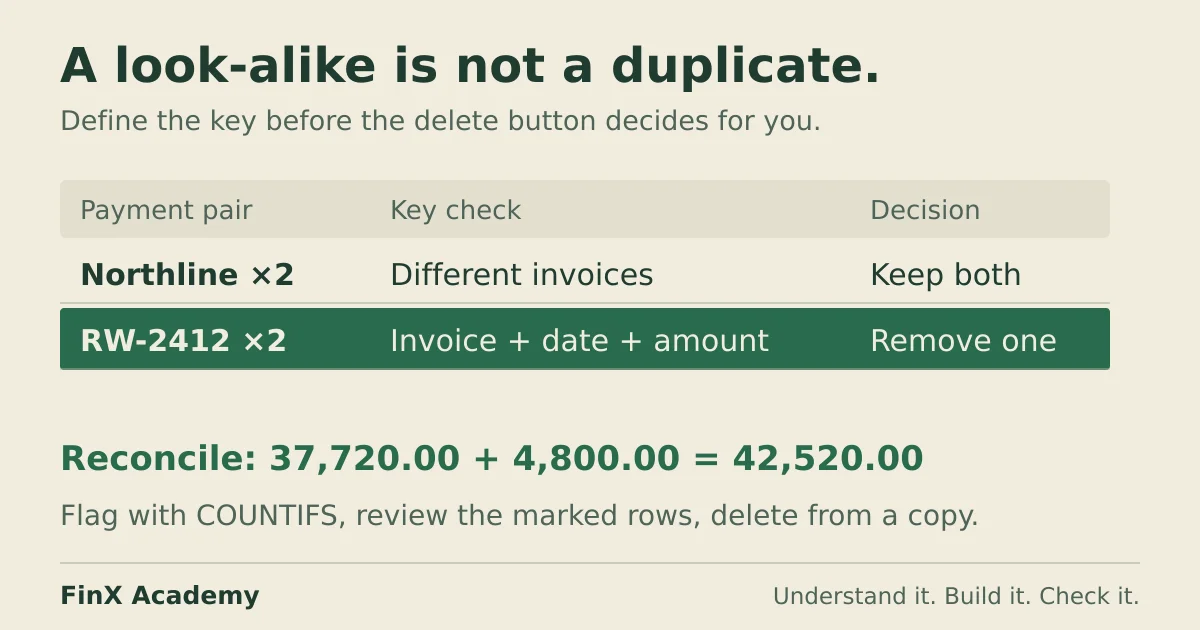
A payments ledger where look-alike rows are real transactions. Derive the composite key, preview removals with COUNTIFS, and reconcile control totals before anything is deleted.
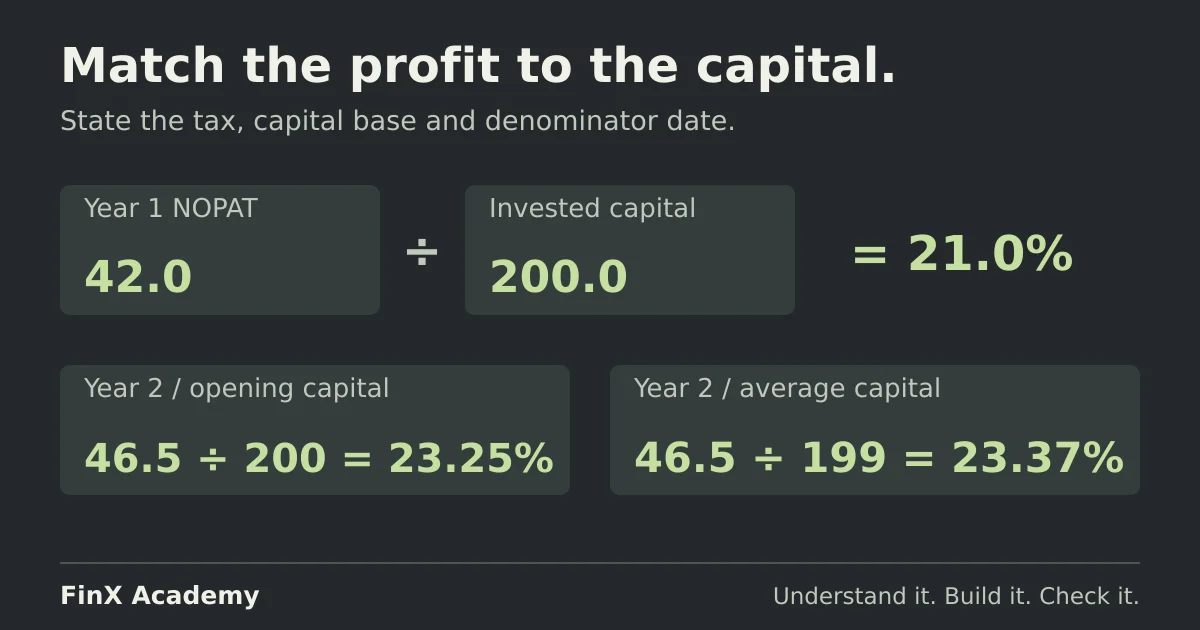
Build and audit a return on invested capital: reconcile NOPAT and invested capital two ways each, choose a denominator convention, and catch three inconsistencies.
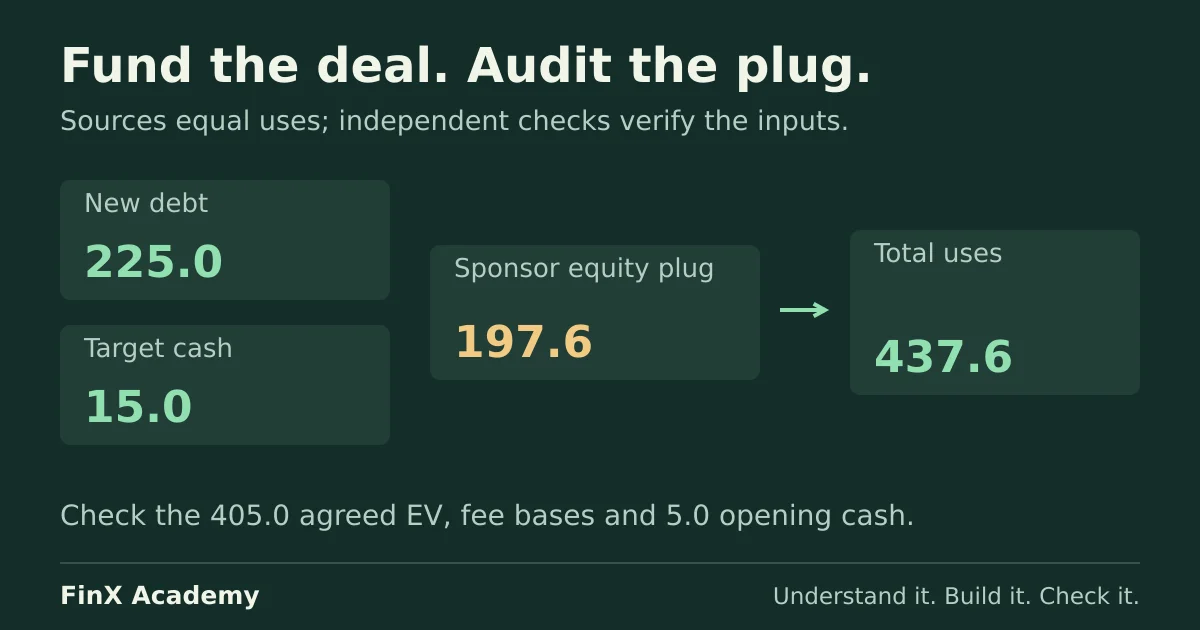
Build a sources and uses table for a fictional buyout: offer basis, refinancing, fees and the sponsor equity plug — then run the checks that catch what the plug hides.
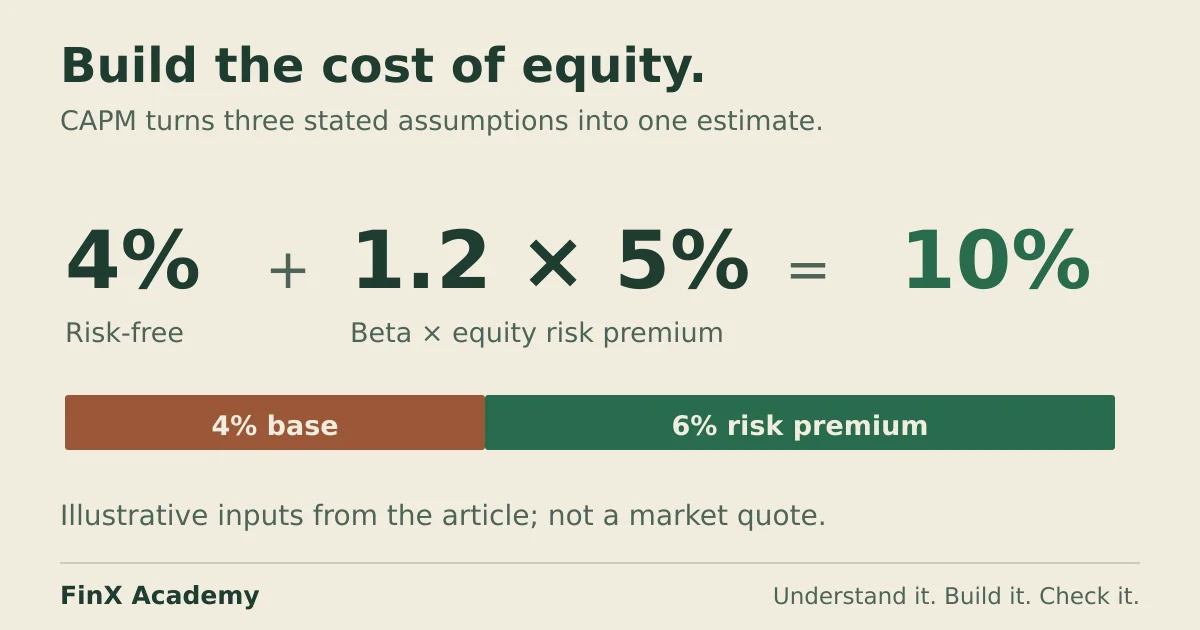
Assemble Northgate's cost of equity from a dated risk-free rate, beta and equity risk premium, catch a 604% units error and two silent wiring errors, and price the range.
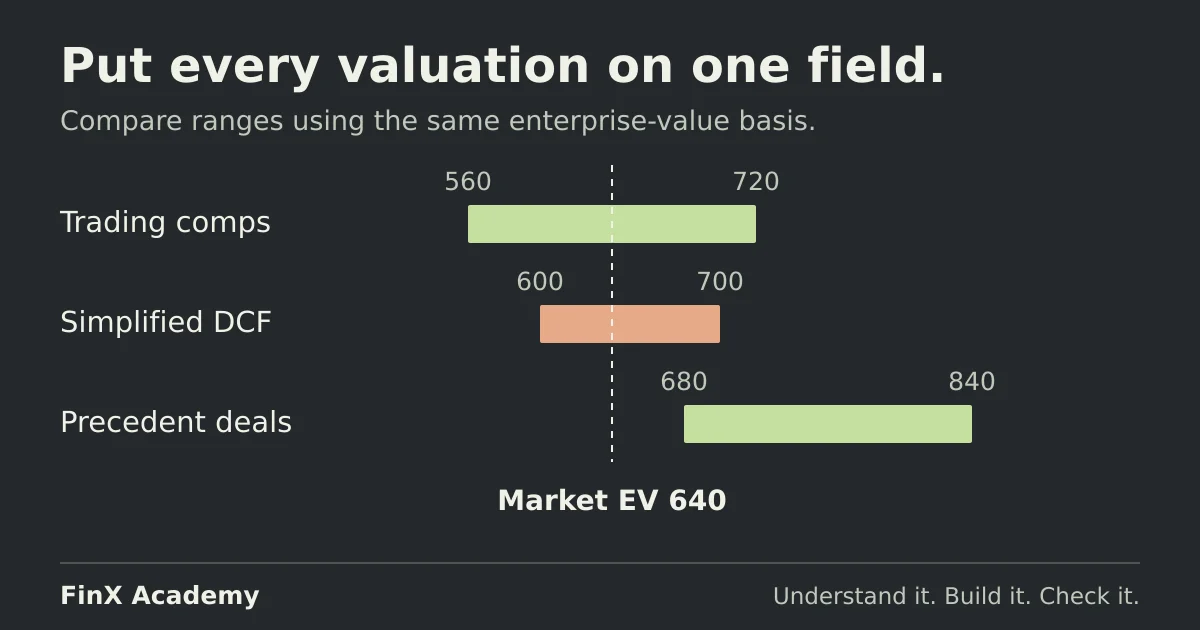
Build a football field valuation chart in Excel with consistent enterprise-value ranges, a market reference, and checked bridges to equity value and value per share.
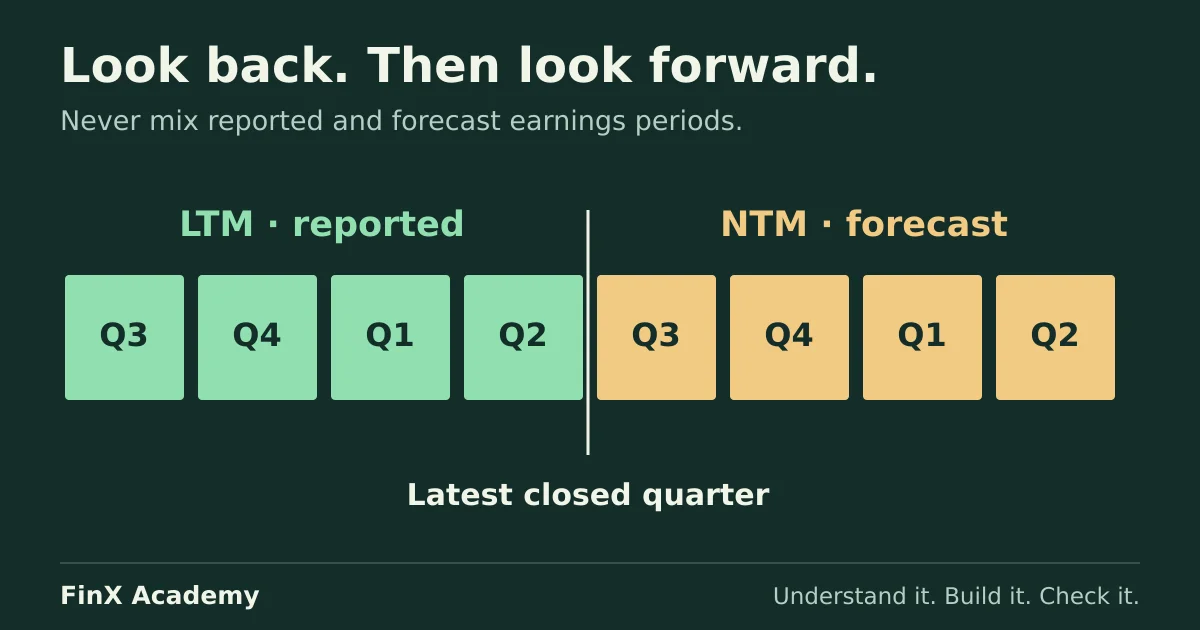
Bridge four fictional quarters into LTM EBITDA, build NTM from a dated forecast, and see the exact 6.67% by which a mismatched denominator imports the growth rate twice.
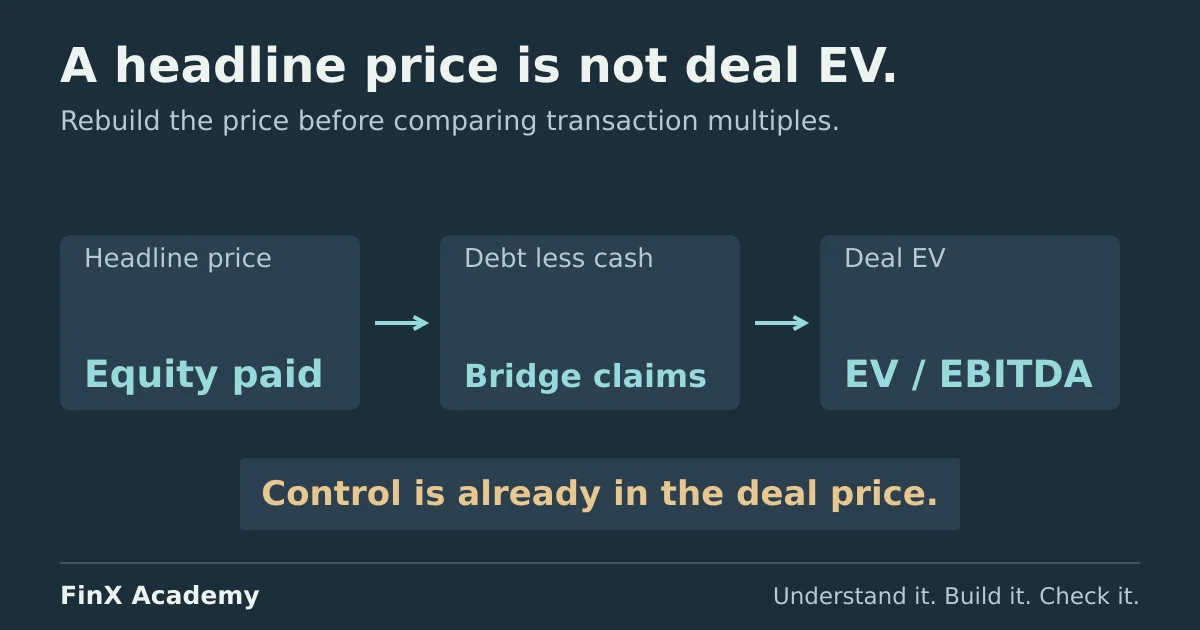
Build a precedent transaction analysis in Excel from a fictional deal set: rebuild headline prices into enterprise value, screen comparability and derive a checked valuation range.
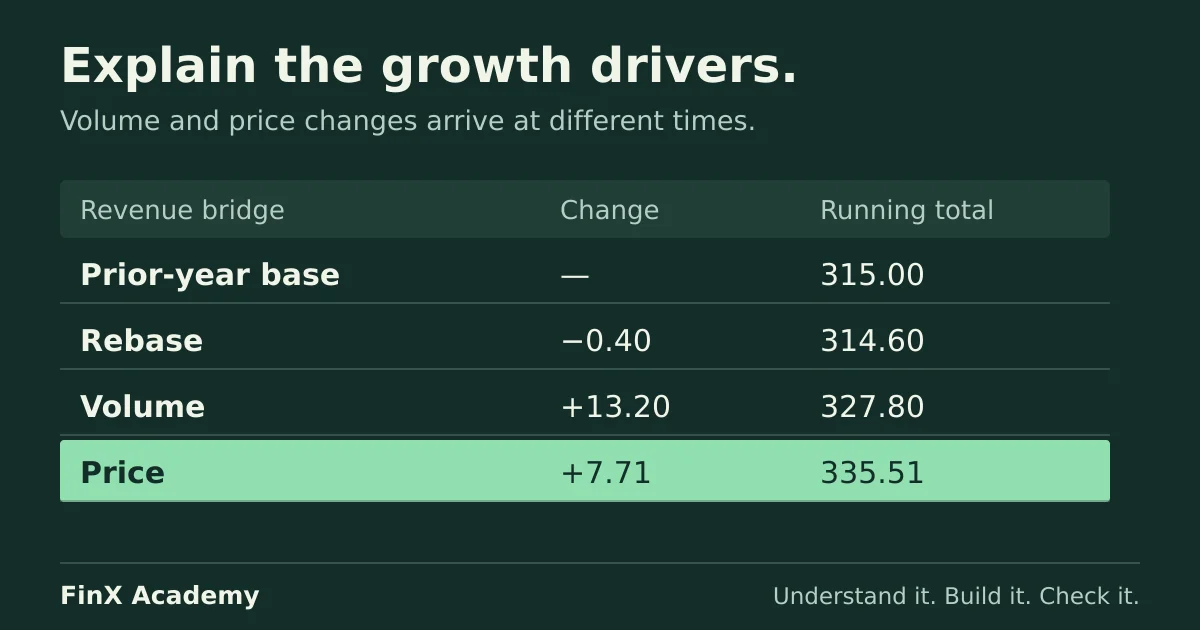
Build a monthly revenue forecast in Excel from contract and job drivers, reconcile the annual bridge, and test changes in pricing and additions.
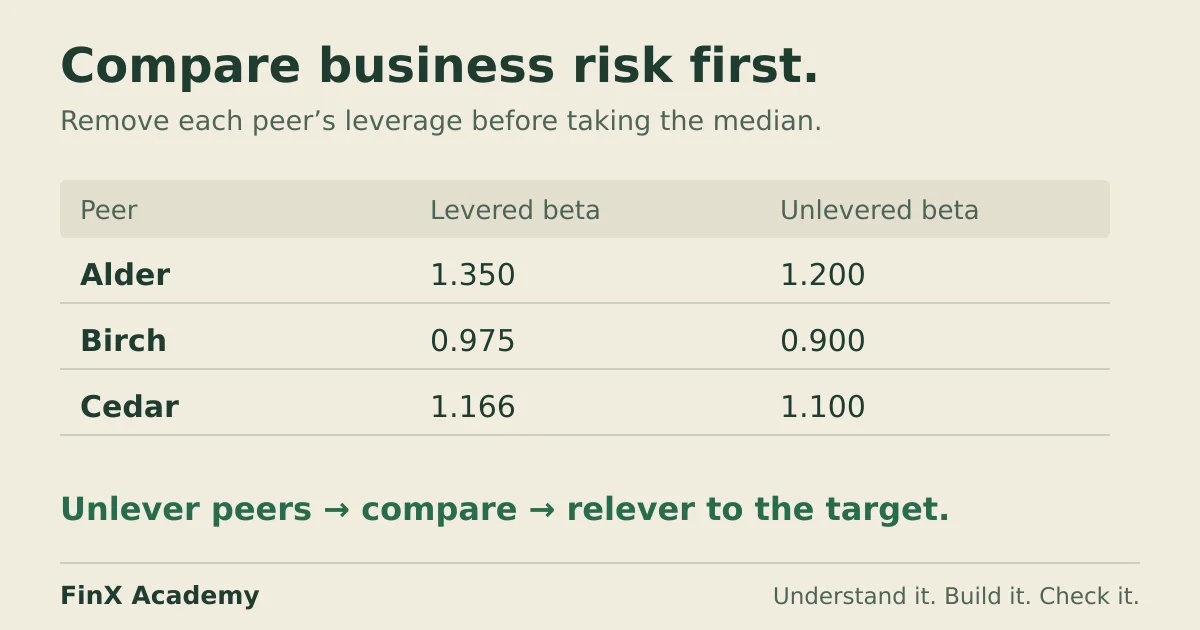
Strip peer leverage with the Hamada formula on a fictional comps set, relever to the target's capital structure, and catch the basis and order errors that distort the result.
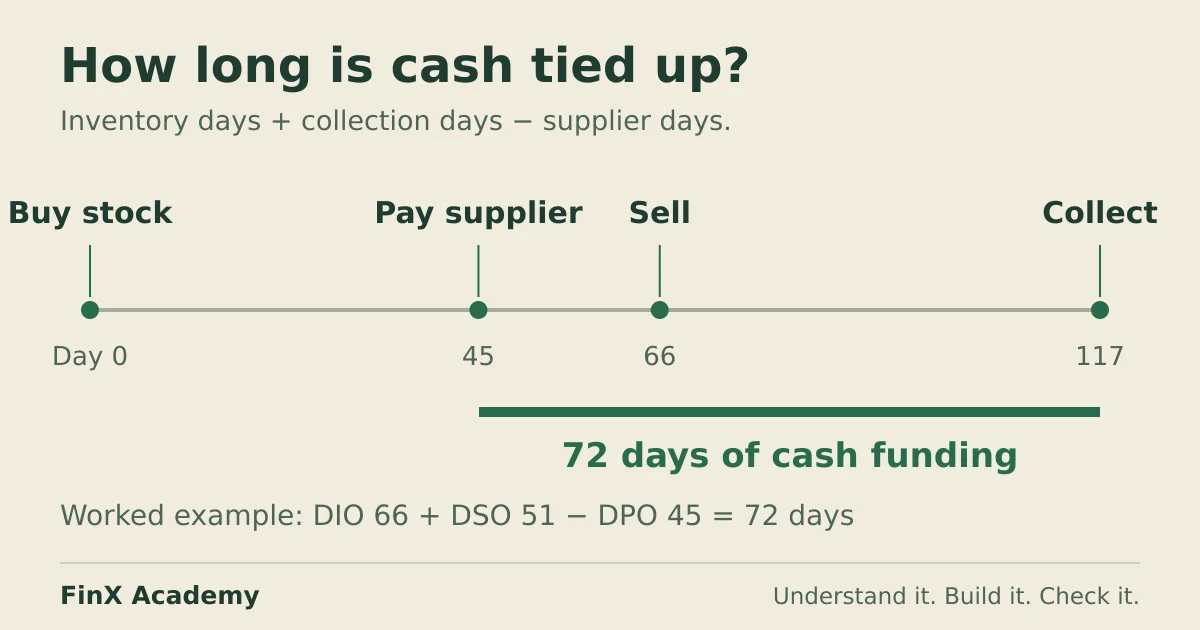
Calculate the cash conversion cycle from a year of financials, see why the answer depends on stated conventions, and turn a longer cycle into the extra cash it funds.
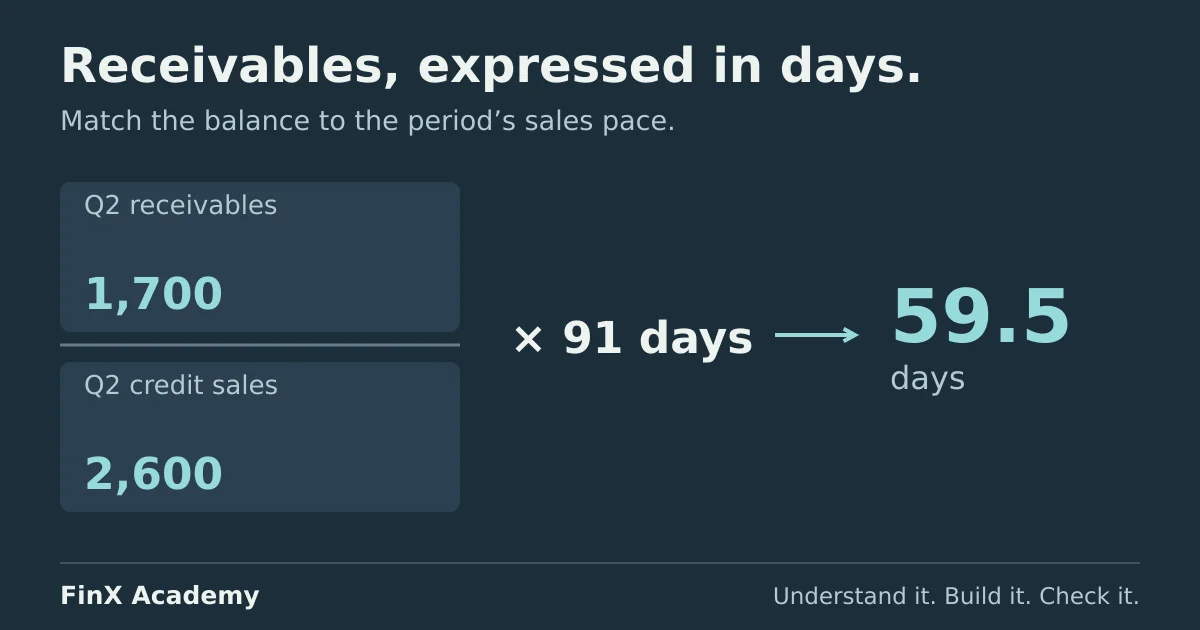
Calculate DSO three ways on a seasonal distributor, catch the year-end snapshot that flatters collections, and turn a defended day-count into a forecast receivables balance.
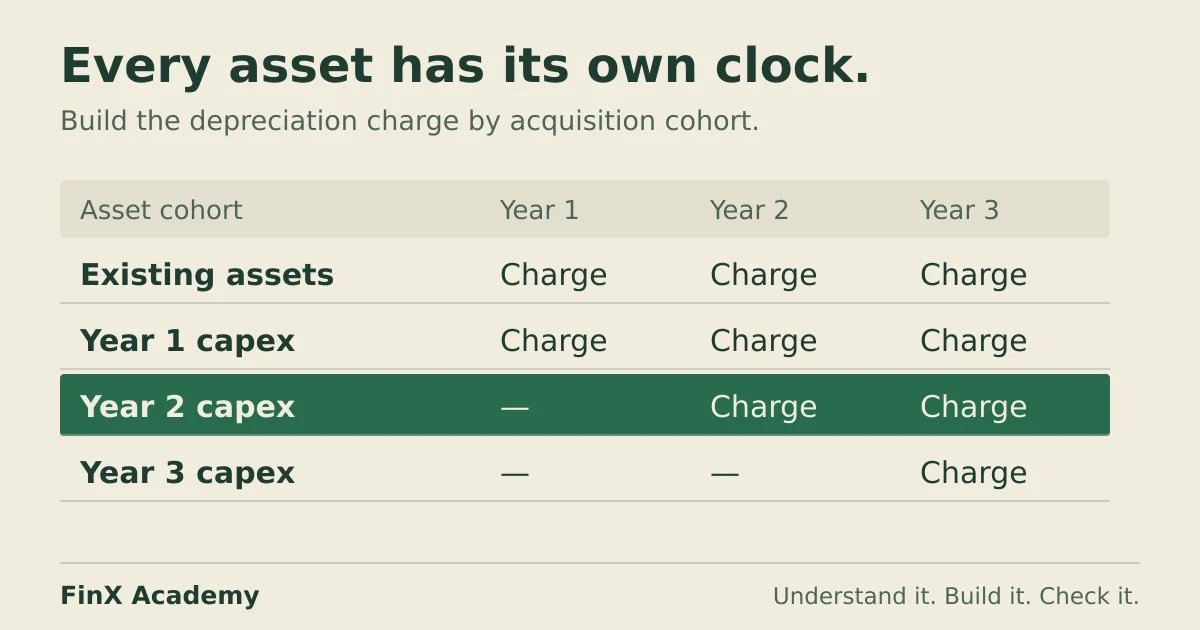
Build a three-year property and equipment schedule in Excel: a cohort table for the charge, roll-forwards for gross and accumulated, and the checks.
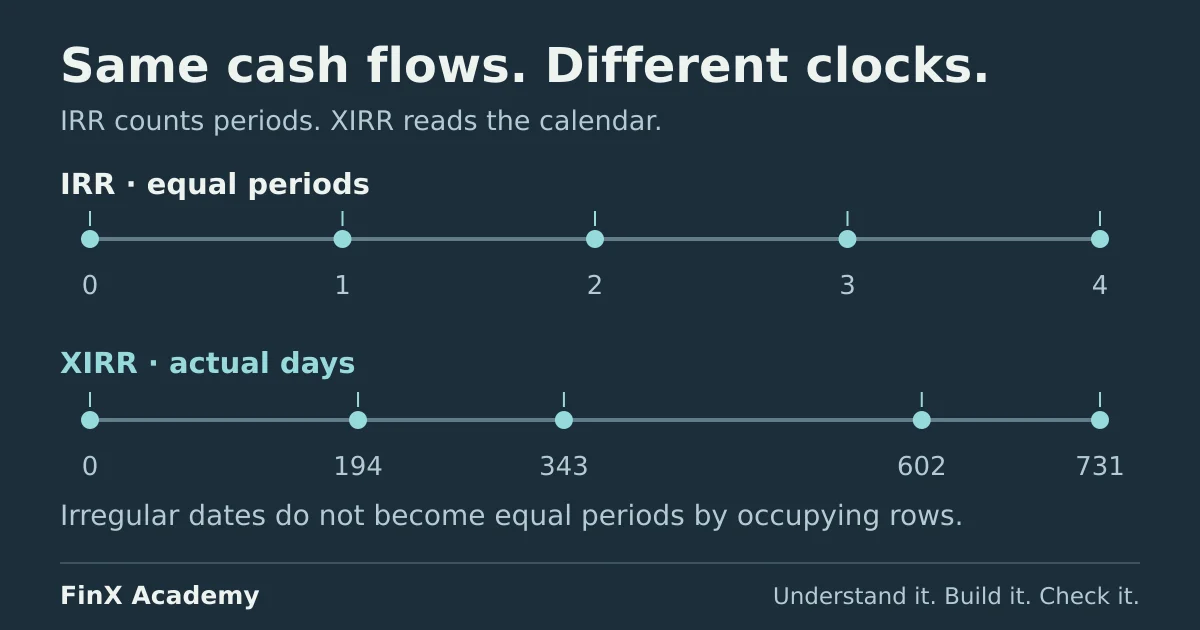
Apply Excel's IRR and XIRR to the same irregularly dated investment, watch the two answers disagree, and learn which function reads the calendar and which only counts rows.
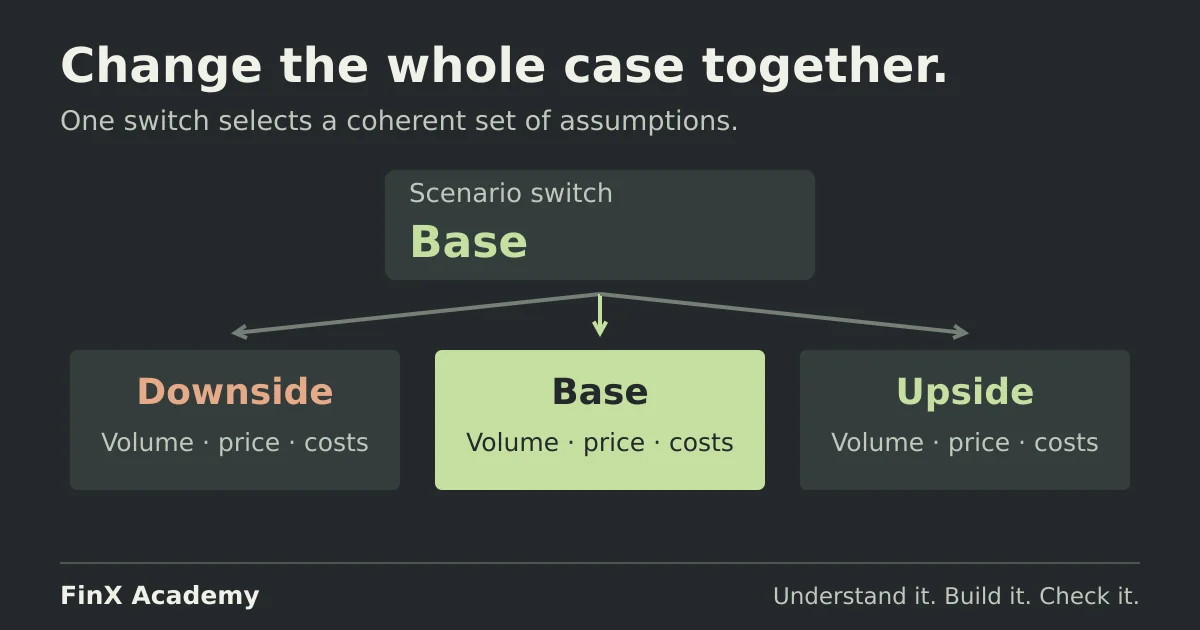
Switch a finance model between base, upside and downside cases with one driver cell, check each case with hand calculations, and see how scenarios differ from sensitivity grids.
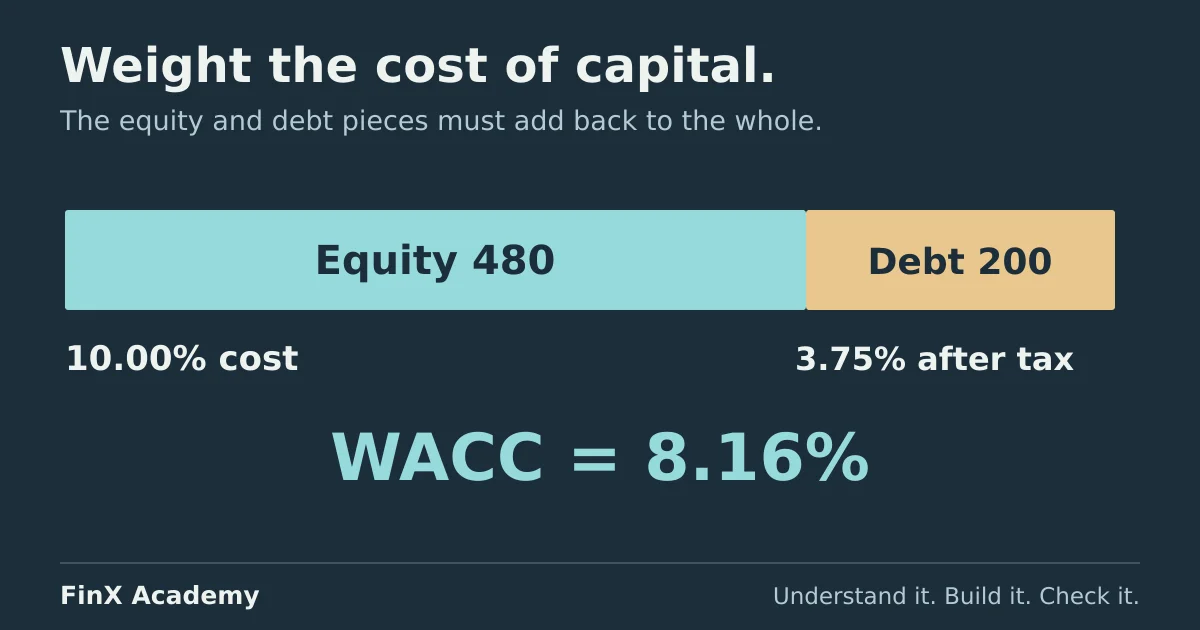
Assemble Northgate's WACC in Excel from a transparent, cell-by-cell assumptions table, cross-check it two ways, and see how a 0.37-point error moves a terminal value.
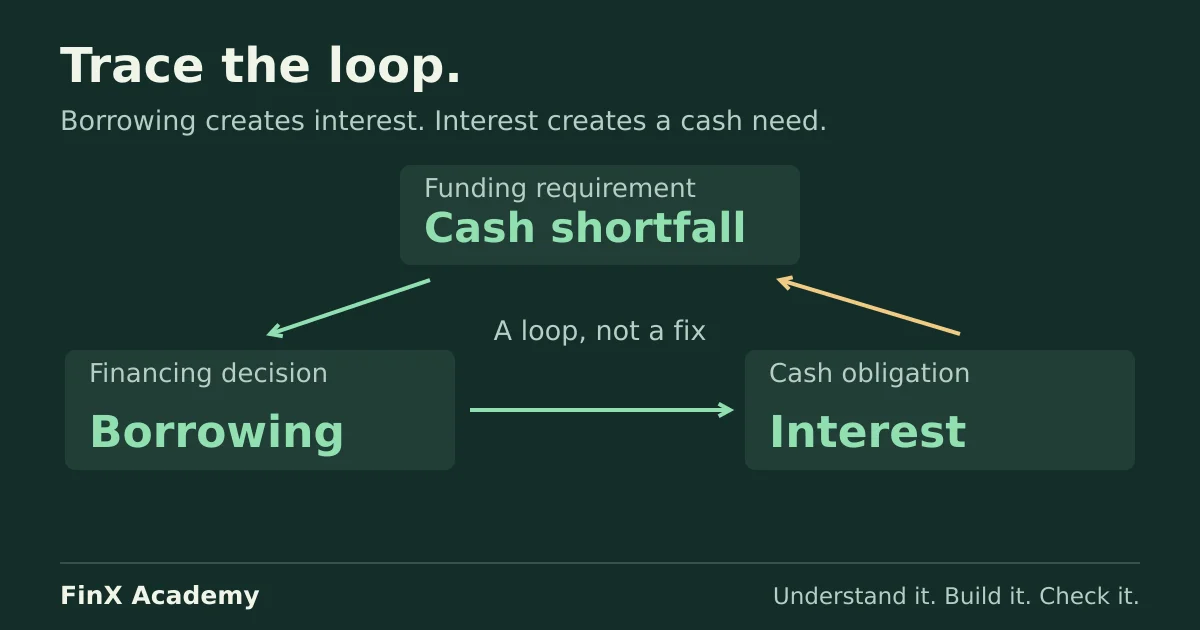
Reproduce an accidental self-including SUM, then build a revolver loop that funds its own interest. Compare timing, algebraic and iteration fixes with checked numbers.
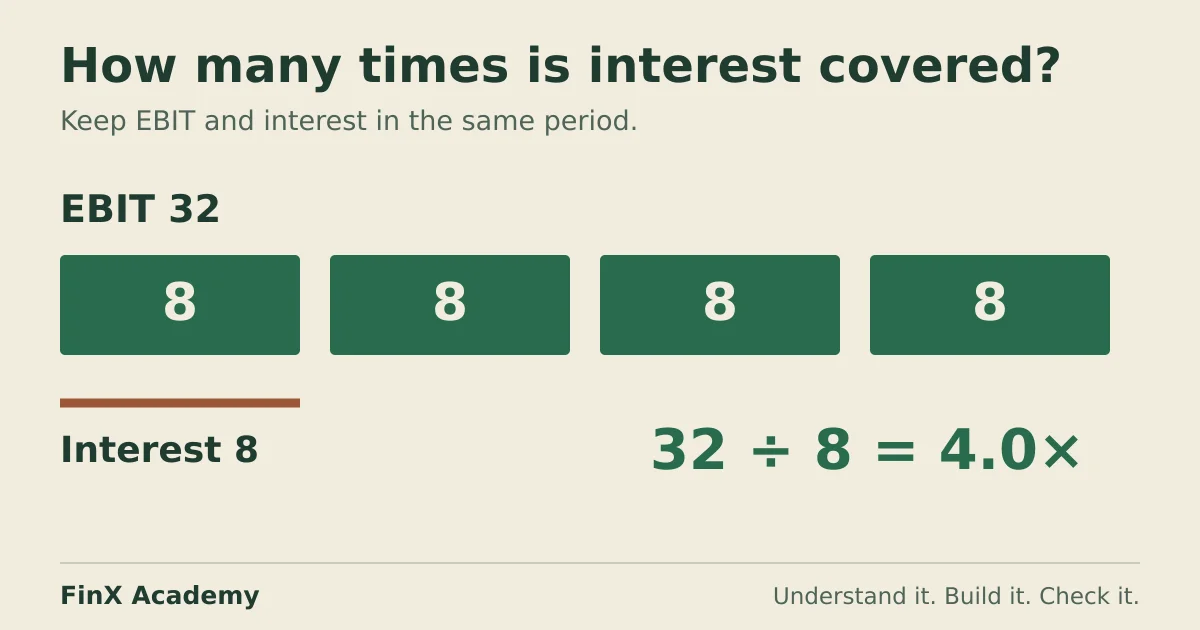
Calculate three years of interest coverage on a fictional borrower, compare EBIT and EBITDA conventions, run a downside and reconcile the interest figure to the debt schedule.
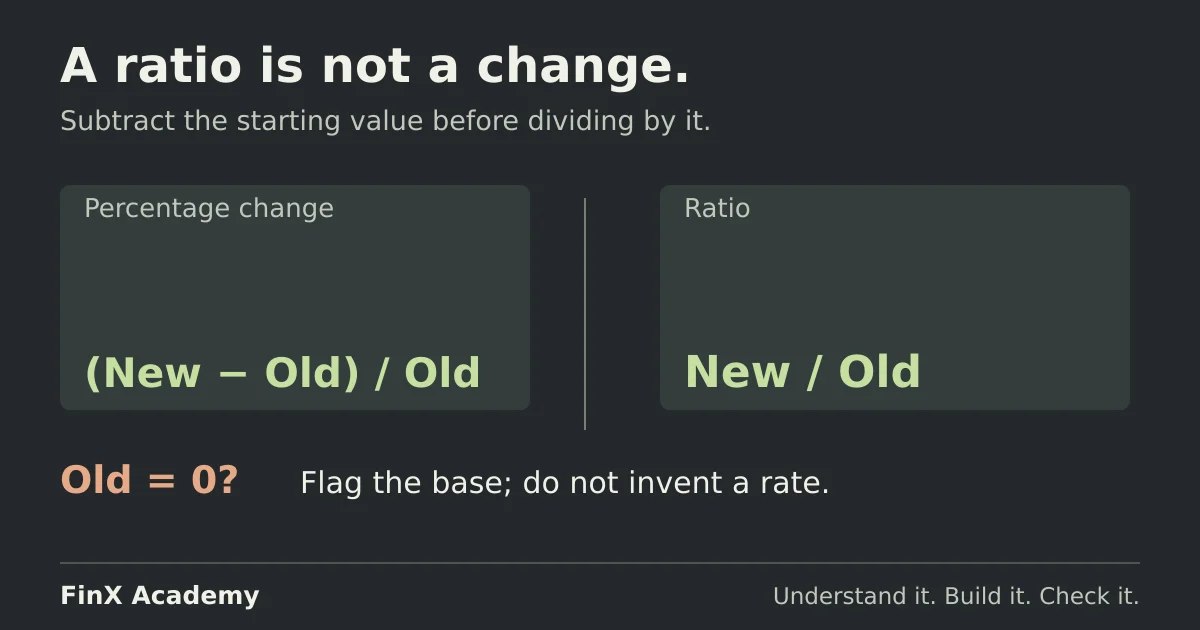
Calculate percentage change in Excel with one formula, catch the ratio-not-change mistake, and handle negative and zero starting values and percentage points on a checked variance table.
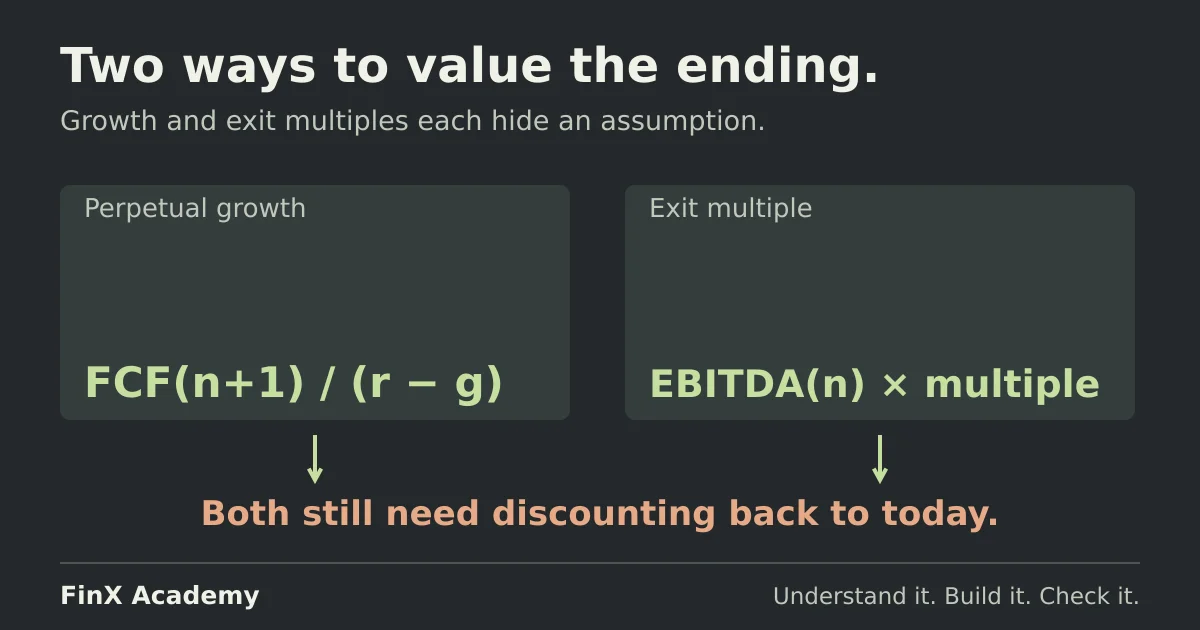
Calculate terminal value both ways on one fictional forecast, discount each correctly to today, and expose the implied growth rate and implied multiple hiding inside your assumption.
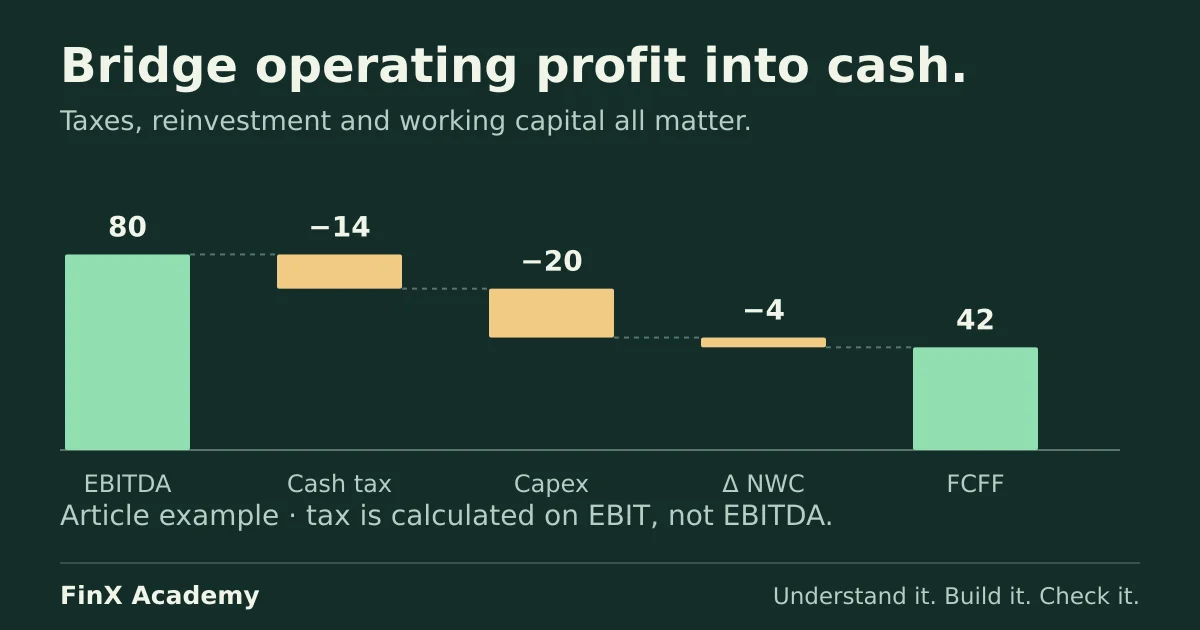
Reconcile EBITDA to unlevered free cash flow in one worked example, cross-check it with a tax-shield shortcut, and see how the levered figure differs.
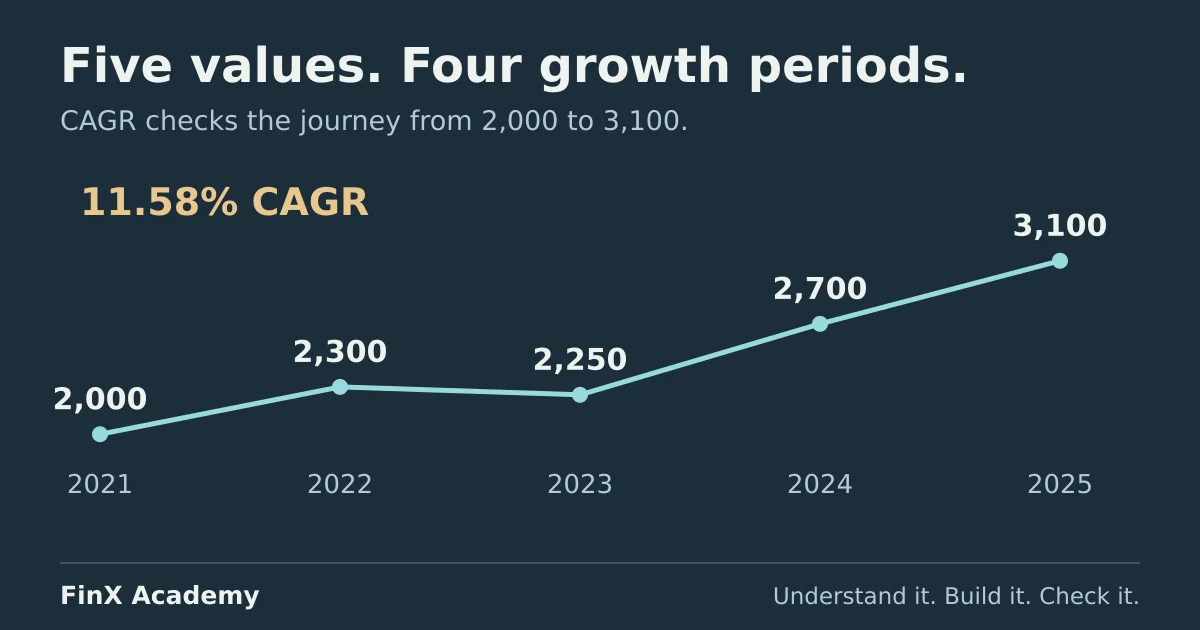
Calculate CAGR in Excel from a five-year revenue series, compare it with the average yearly growth rate, catch the off-by-one period count and convert an annual rate to monthly.
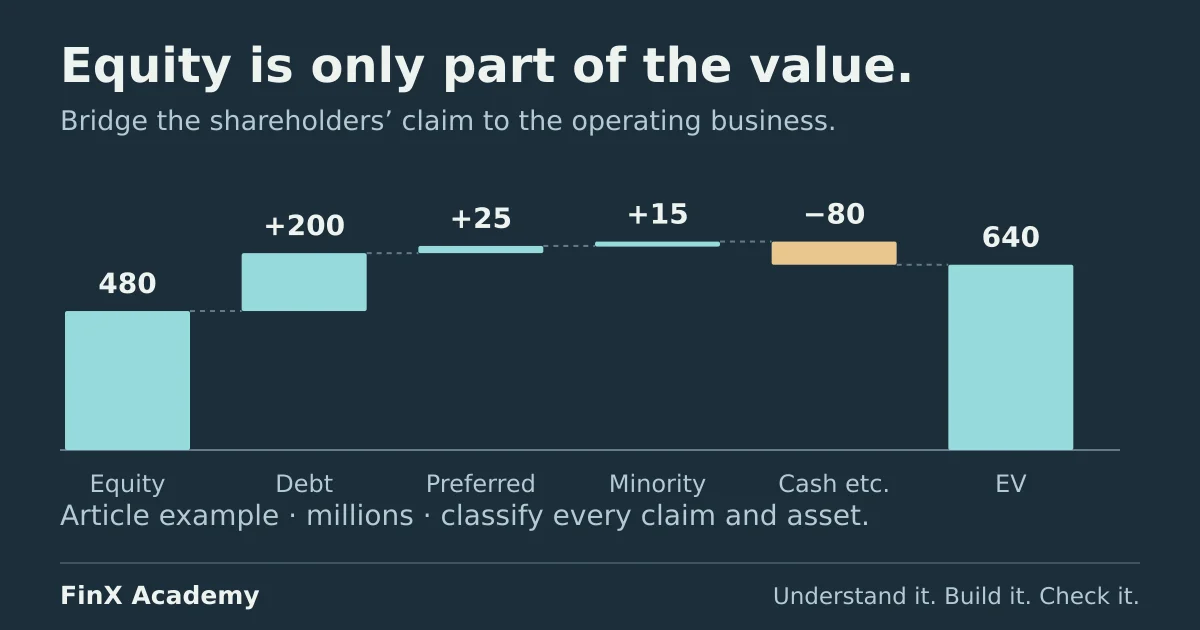
Work out what each measure values, classify debt, cash and other claims, and bridge between enterprise value and a per-share equity value with checked answers.
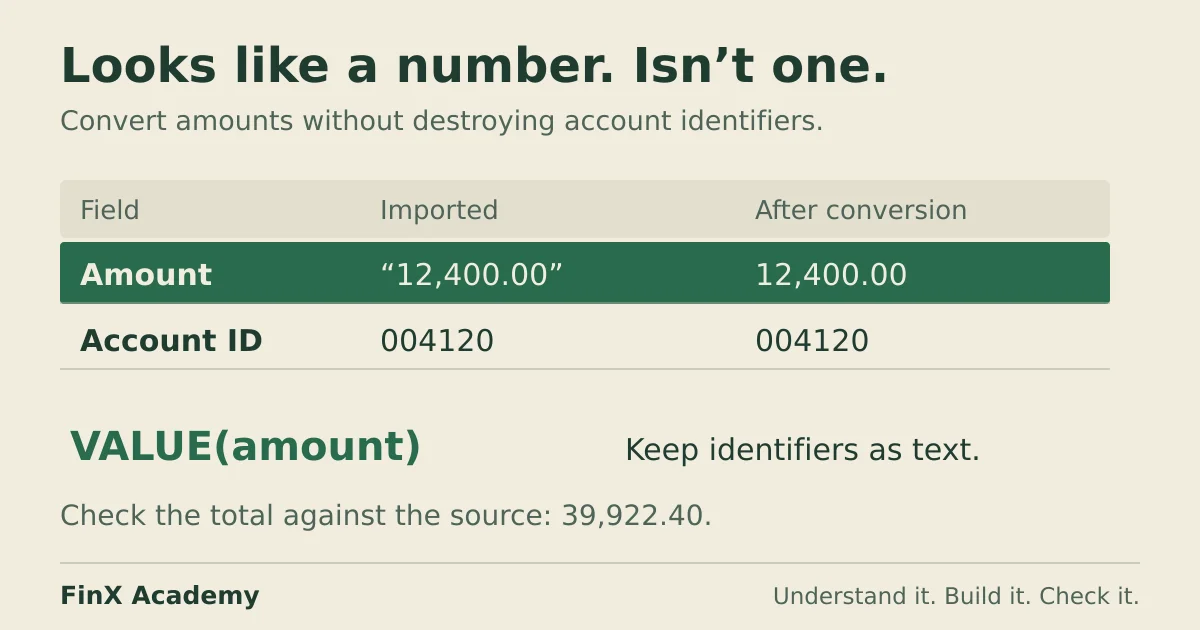
Diagnose a total that silently ignores text-stored amounts, convert the amount column with VALUE or Paste Special, and keep leading-zero account codes intact.
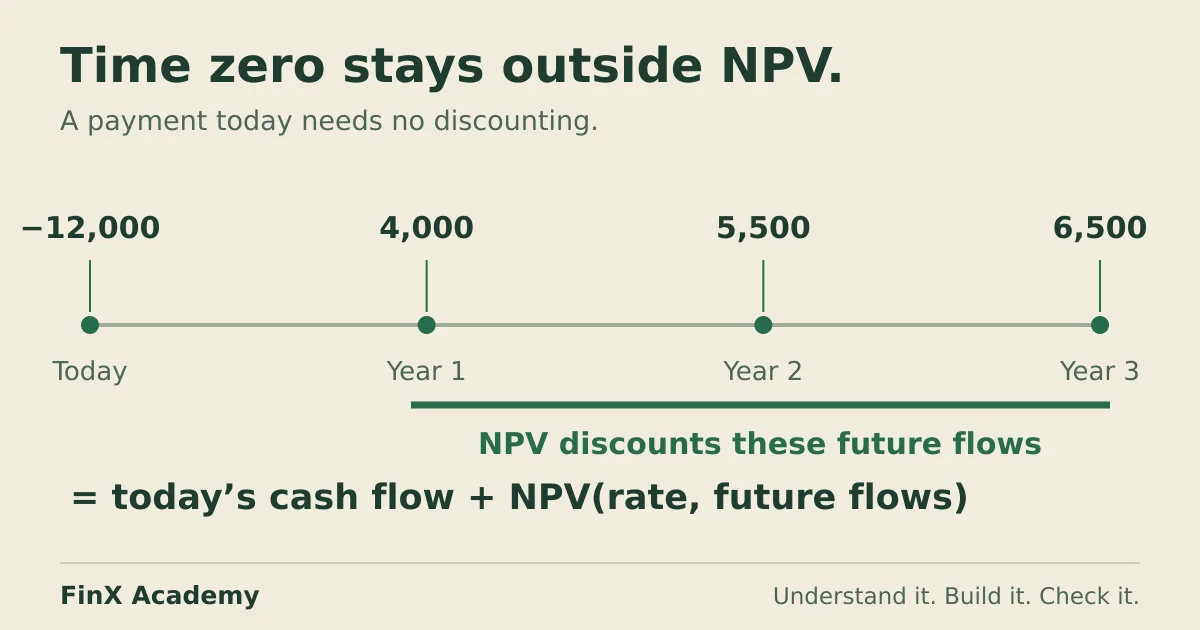
Calculate NPV in Excel from a small project schedule, see why the time-zero payment belongs outside the NPV function, and compare periodic NPV with dated XNPV.
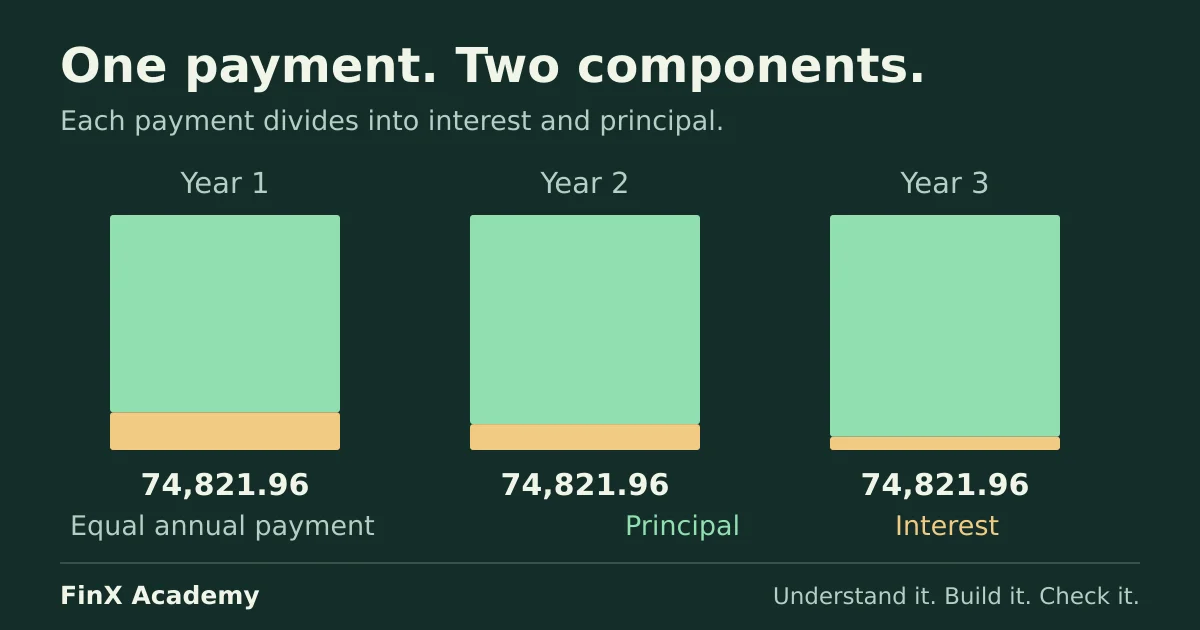
Calculate a loan payment with Excel's PMT function, keep the sign and rate-period conventions straight, and reconcile every payment into interest and principal.
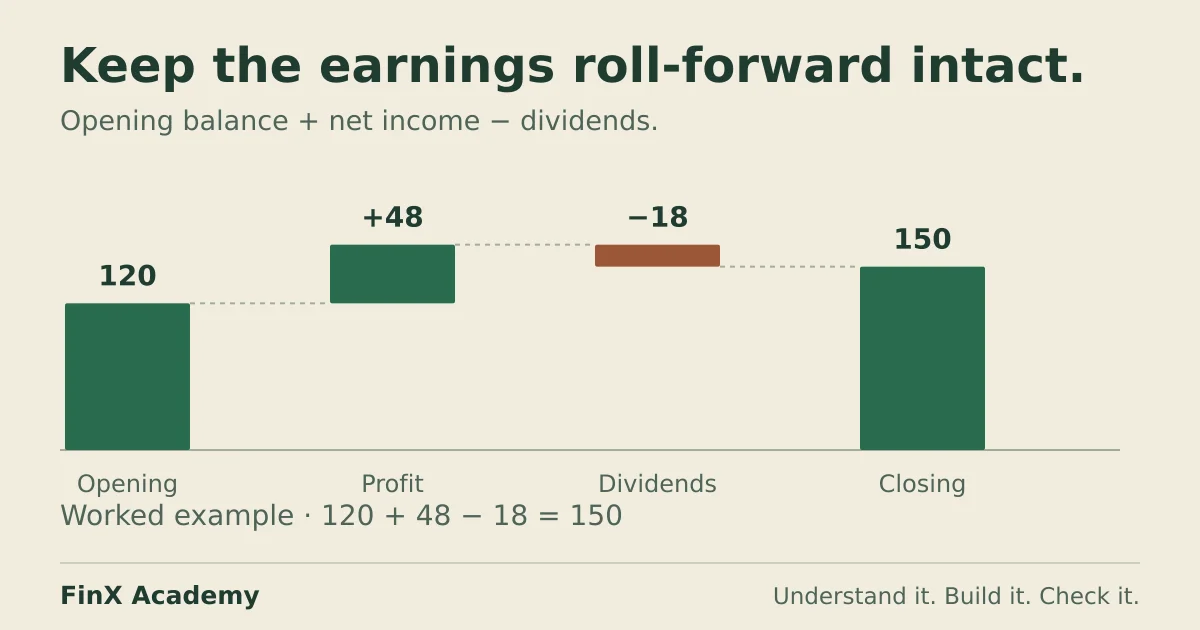
Build a two-year retained earnings roll-forward with a profit year and a loss year, catch a dividend sign error and reconcile the result to balance-sheet equity.
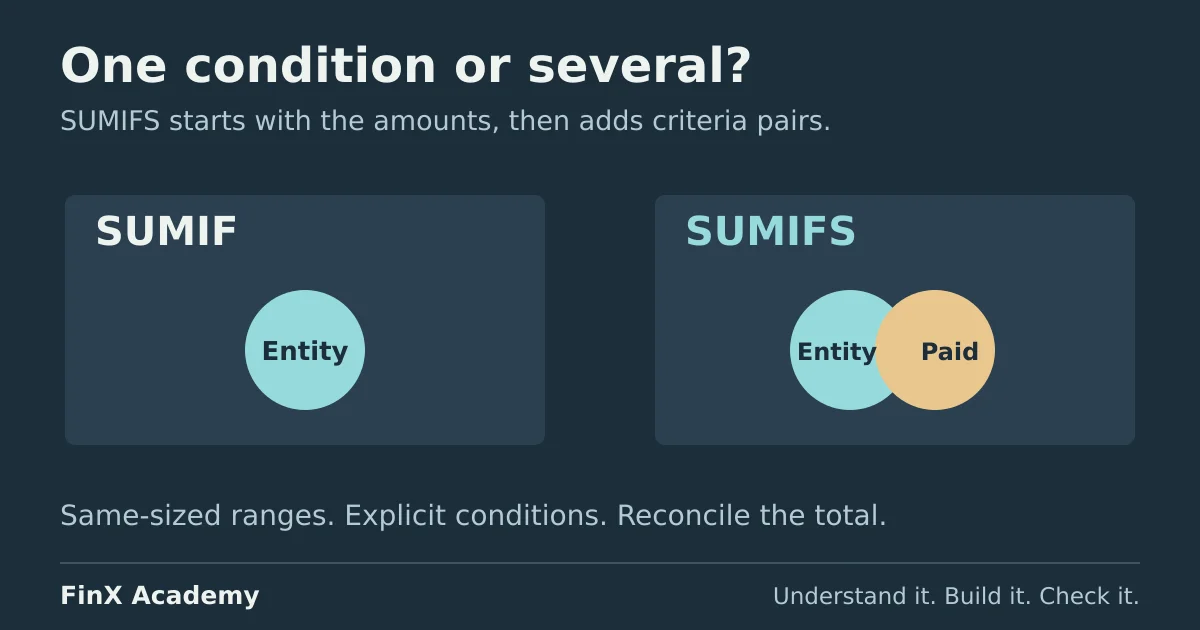
Compare SUMIF and SUMIFS on a small invoice ledger: entity and status totals, January date boundaries, silent argument-order zeros and a reconciliation check.
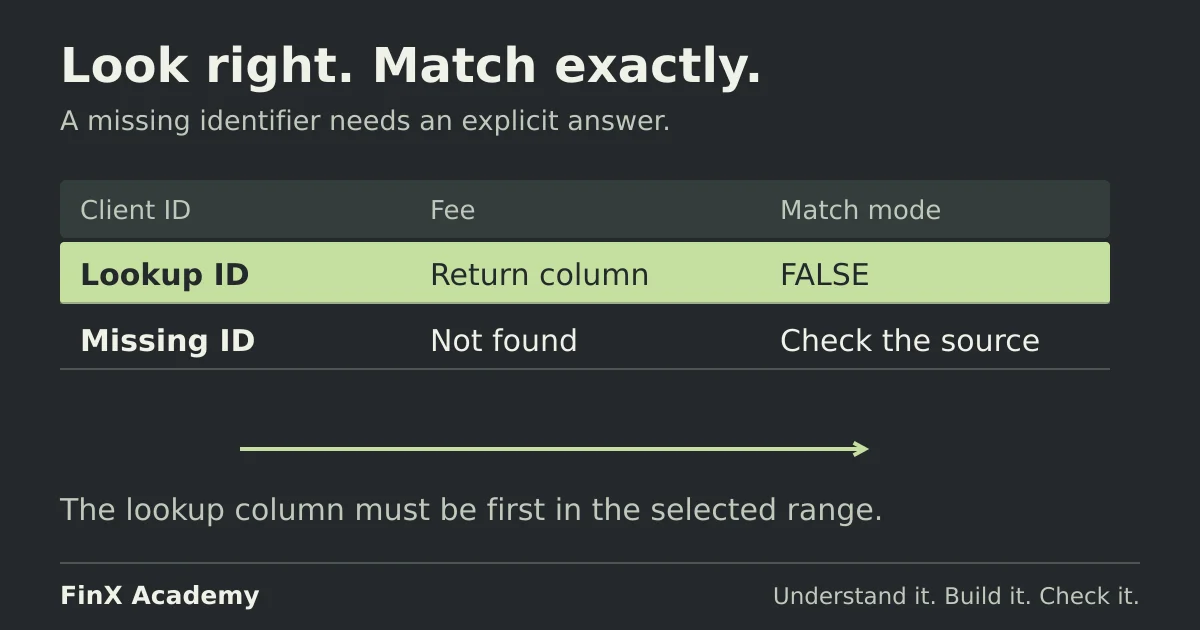
Practise VLOOKUP on a fictional fee ledger: exact matching, a copied formula that breaks and a missing client — with worked answers and checks.
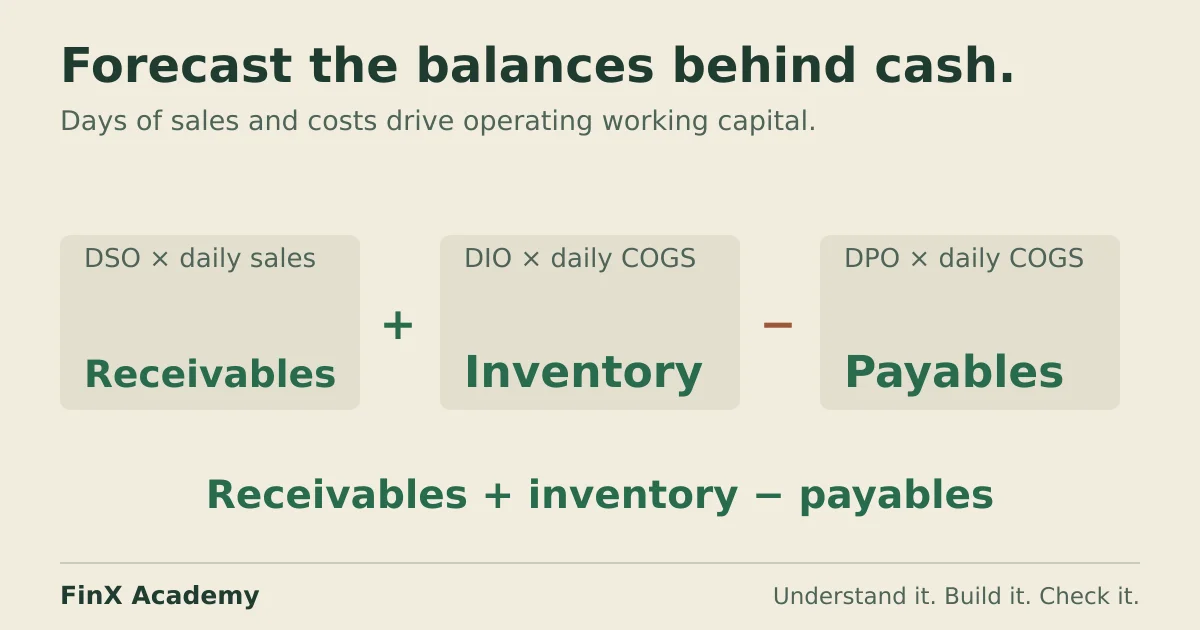
Build a three-year operating working capital schedule from DSO, DIO and DPO drivers, check the cash-flow sign of each change and catch a payables forecast on the wrong base.
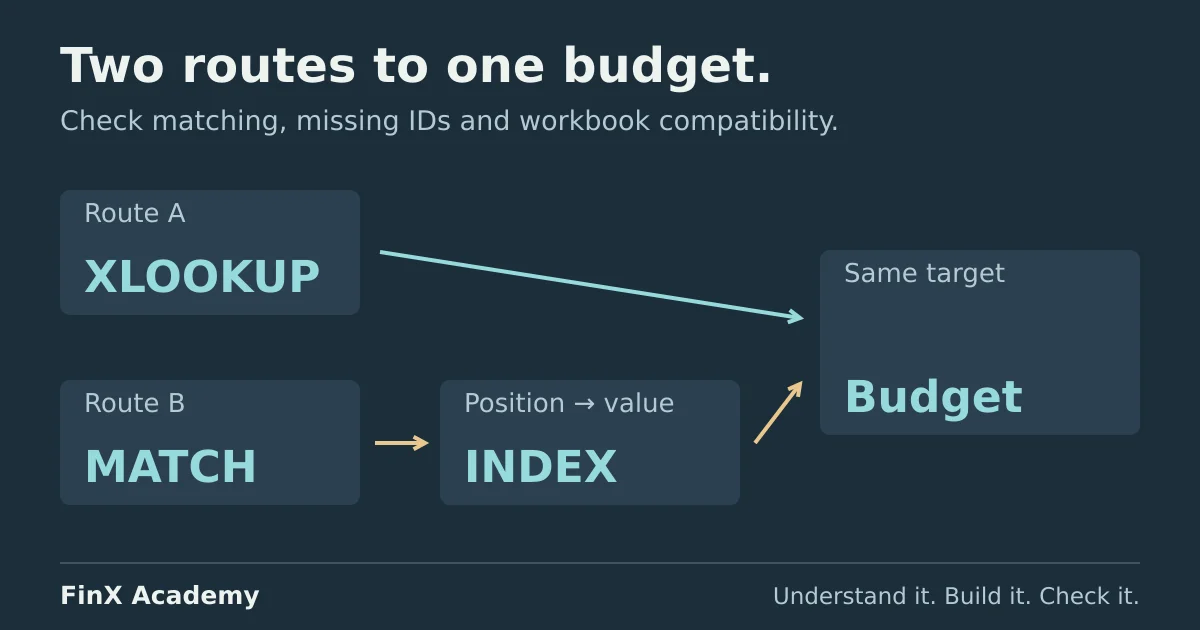
Compare XLOOKUP and INDEX MATCH with the same Excel budget example. Check exact matches, missing IDs, two-way lookups and workbook compatibility.
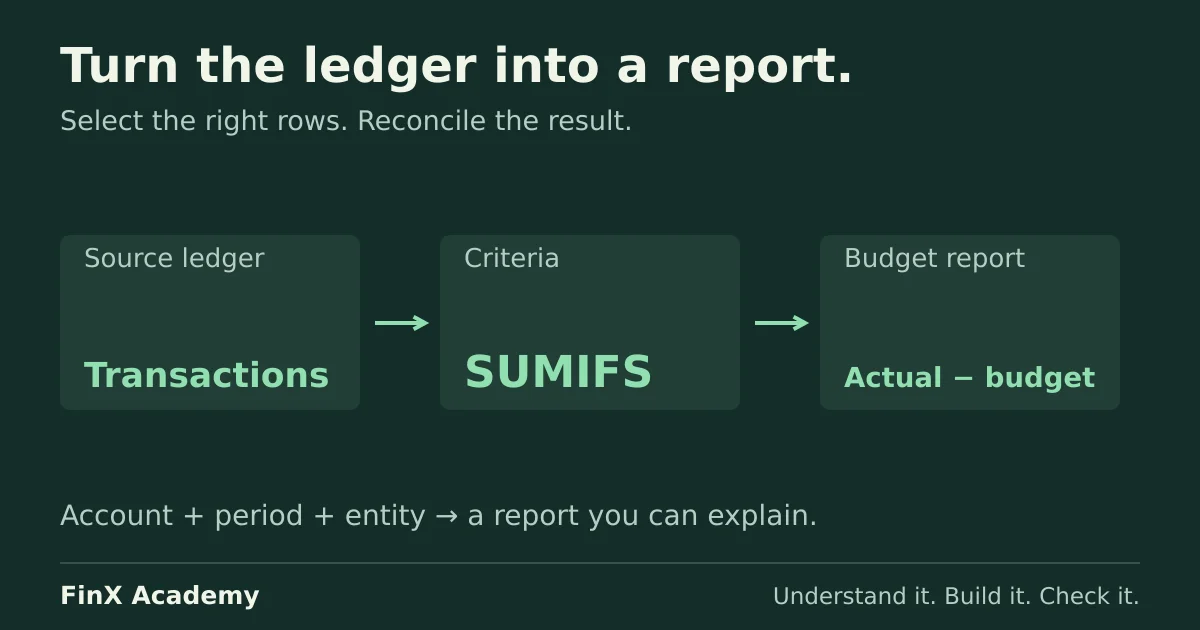
Learn Excel for finance through a practical skills sequence and a checked budget report. Use SUMIFS, copied references, variance analysis and source reconciliation.
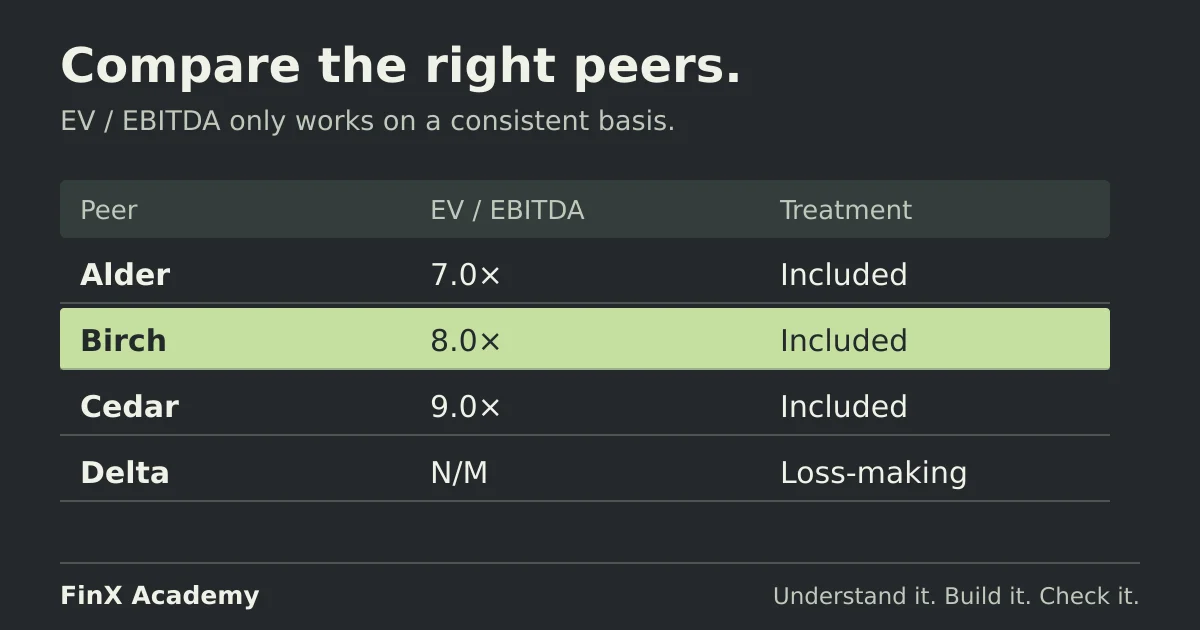
Build a trading-comps example in Excel: select peers, calculate EV/EBITDA, handle a loss-making company and bridge enterprise value to equity value with checked answers.
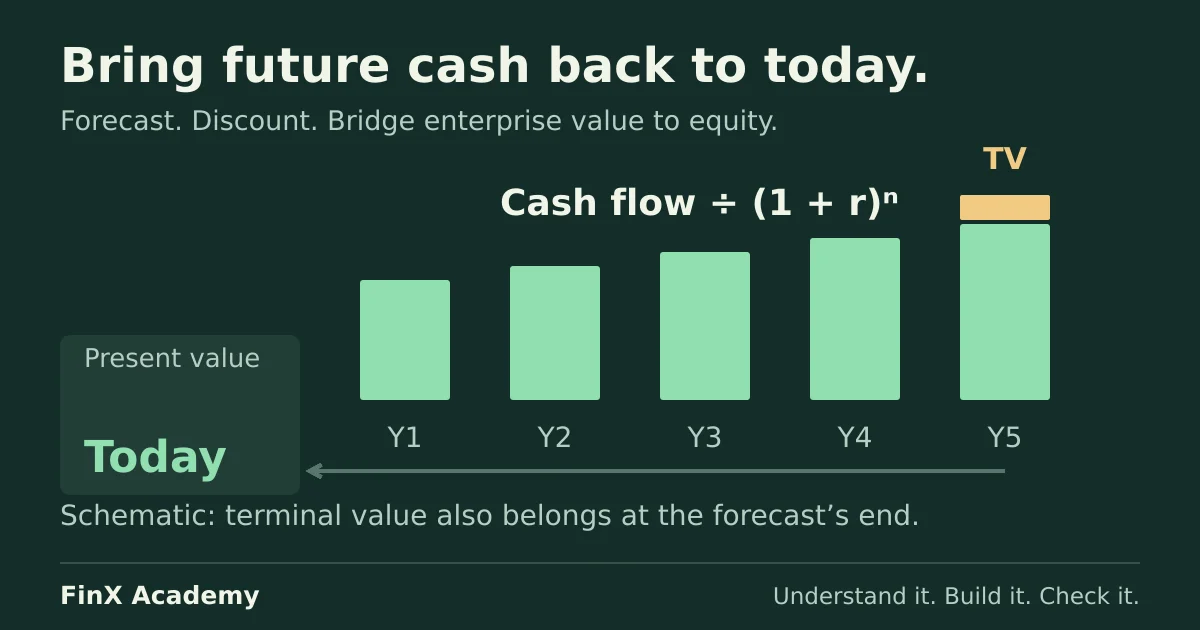
Build a five-year DCF model in Excel with checked formulas, a terminal-value timing fix and a sensitivity table. Follow the bridge from enterprise to equity value.
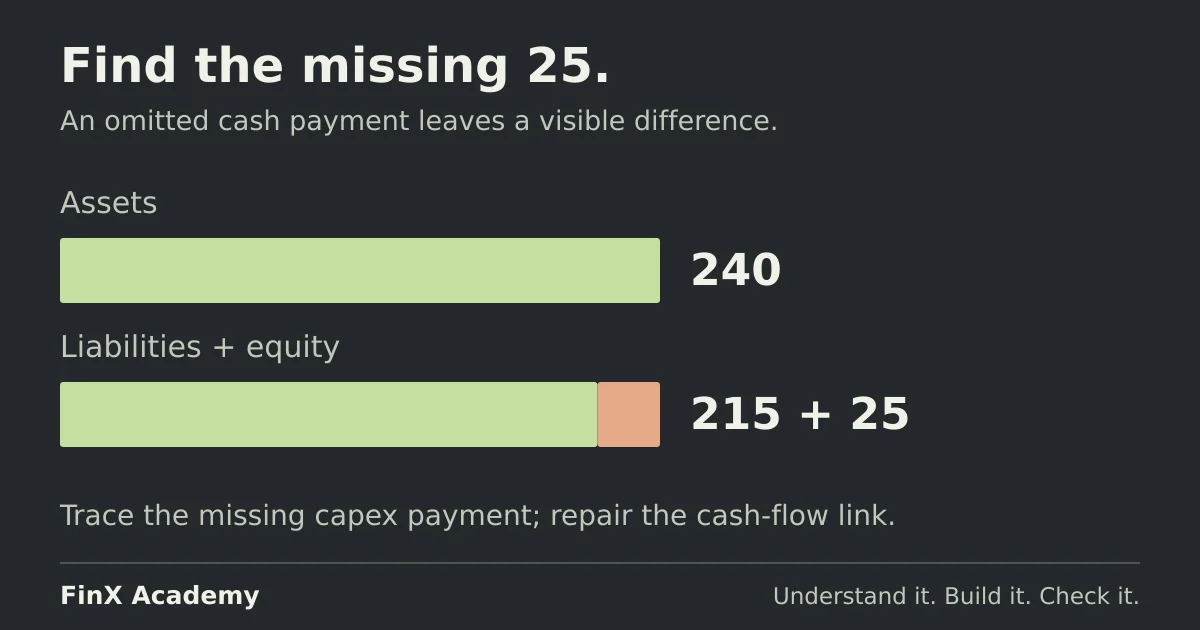
Find a missing cash-flow entry in a worked financial model. Reconcile cash, debt and equity, then test whether your correction fixes the cause.
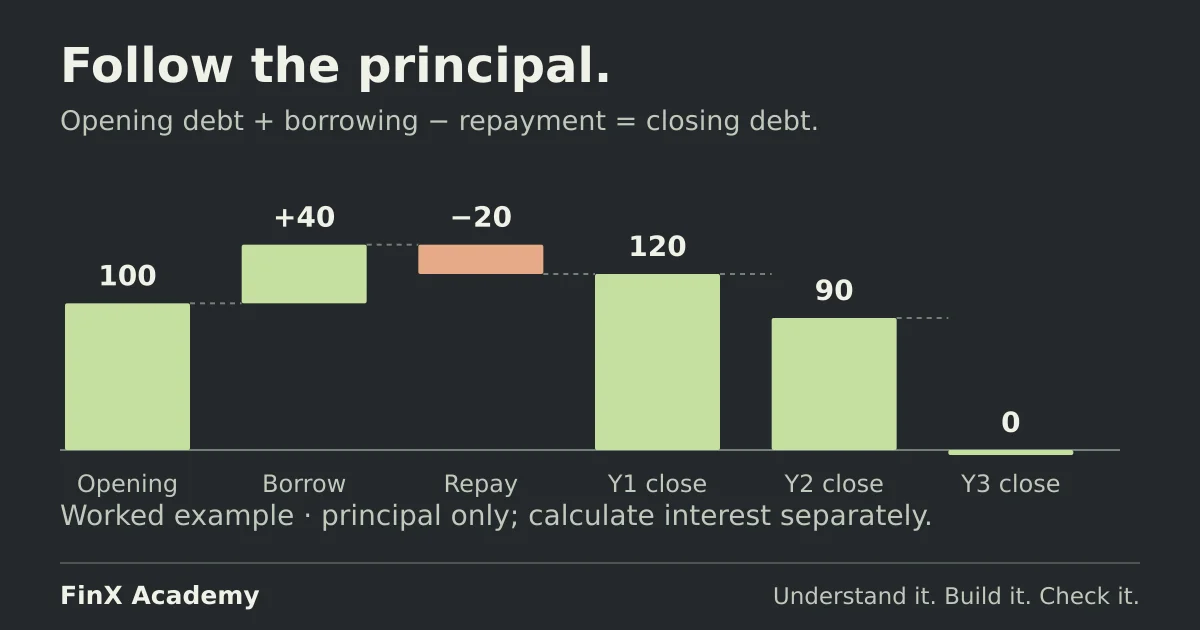
Build a three-year debt schedule with borrowing, capped principal repayments and interest. Check the cash-flow links and see why payment timing matters.
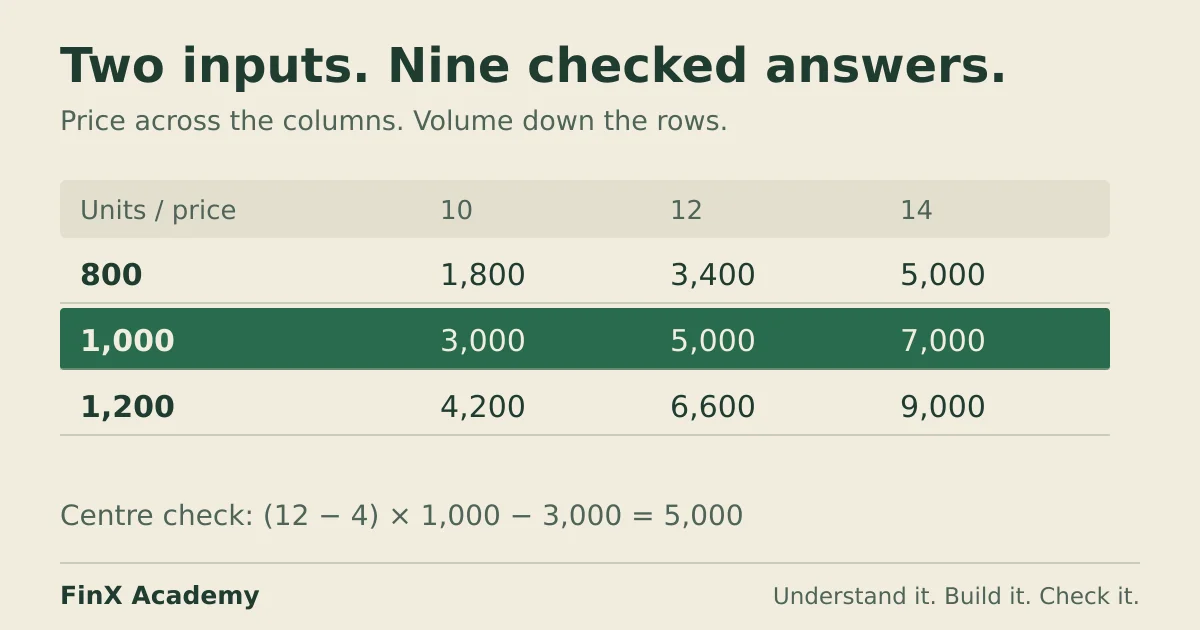
Build a price-and-volume sensitivity grid with copied formulas, check all nine answers, and compare the setup with Excel's native two-variable Data Table.
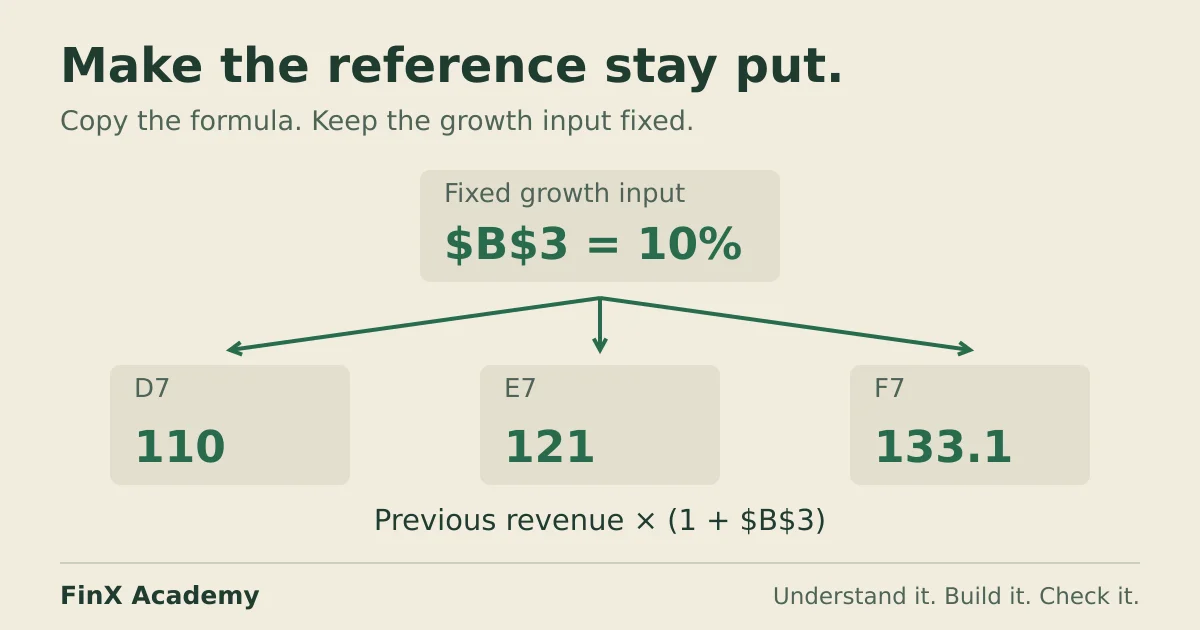
Learn when to use absolute, relative and mixed references, then follow a finance example where one missing dollar sign changes the result.
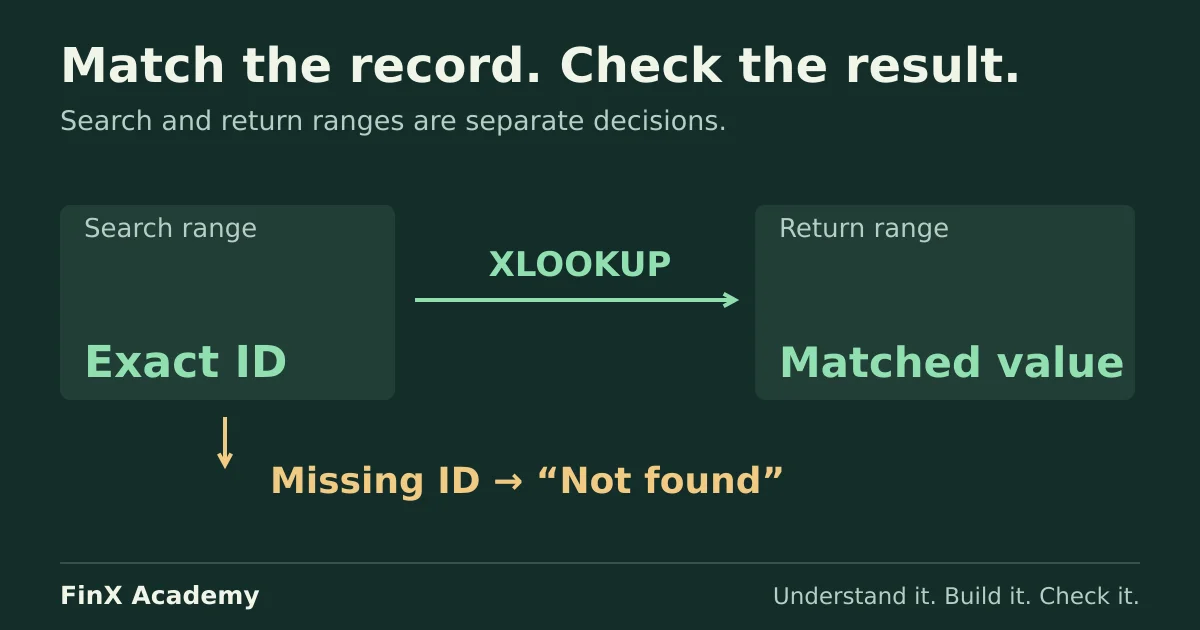
Practise an exact-match lookup with a small finance table. Check missing values and repeated records before trusting the answer.
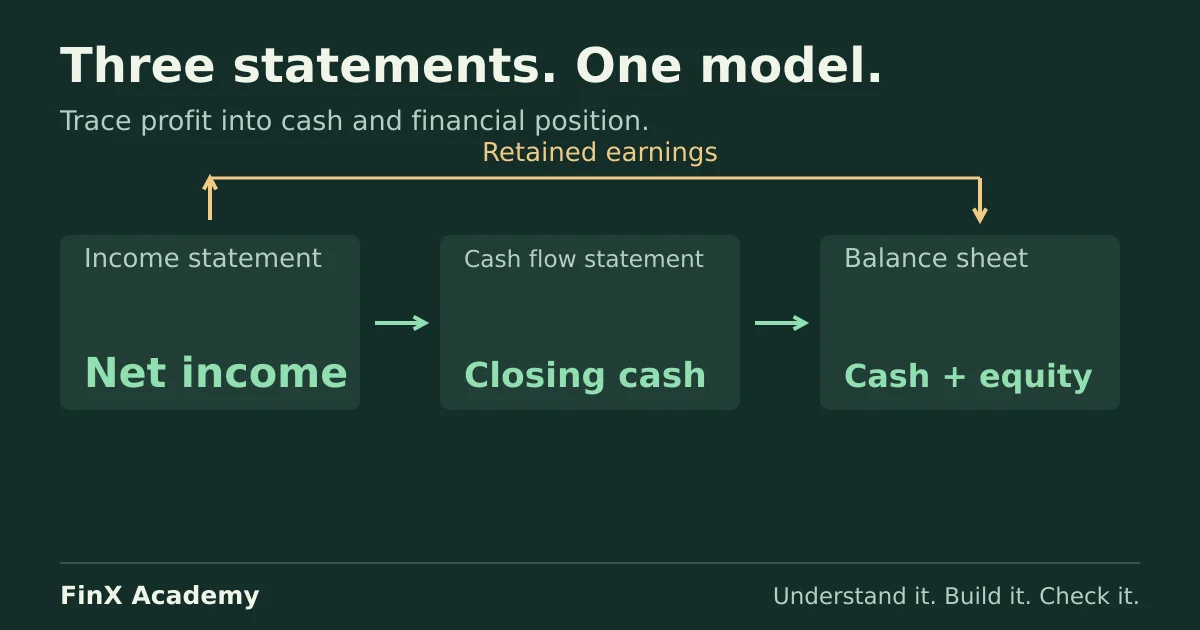
Understand how the income statement, cash flow statement and balance sheet connect, with a small worked example and checks you can repeat.