DSO is receivables expressed as days of sales, so the pace chosen for the sales denominator decides the answer. A year-end snapshot understates a seasonal business's collection period; use period-matched or averaged balances, then forecast the balance as daily sales times the defended day-count.
Days sales outstanding (DSO) answers one question: how many days of sales are currently sitting in receivables, waiting to be collected? The formula is a division plus a scaling:
DSO = receivables ÷ (credit sales ÷ days in period)That’s the whole mechanism — and its one trap. Receivables are a balance at a single instant; sales are a flow over a period. The number you report depends entirely on which instant and which flow you pair, and both are conventions you must state. This article calculates DSO three ways for a fictional seasonal distributor, shows the three answers disagreeing by more than 30 days, finds out which one describes collections and which one is an artefact of calendar luck, and finishes by forecasting the receivables balance a working-capital schedule will later turn into a cash effect. Figures are in thousands of dollars, all fictional; payment terms are Net 60.
The seasonal business
Halden Outdoor Supply sells garden and patio goods; its trade is heavily concentrated in spring and summer, and its year-end in late December sits at the seasonal low. Its first full year runs on the calendar (2025 is not a leap year). Enter the record — one row per period, closing balance at each quarter end:
| Row | A: Period | B: Net credit sales | C: Days | D: Receivables at period end |
|---|---|---|---|---|
| 4 | Opening, 31 Dec 2024 | — | — | 600 |
| 5 | Q1 2025 | 1,200 | 90 | 900 |
| 6 | Q2 2025 | 2,600 | 91 | 1,700 |
| 7 | Q3 2025 | 1,400 | 92 | 1,000 |
| 8 | Q4 2025 | 800 | 92 | 640 |
| 9 | FY2025 | =SUM(B5:B8) → 6,000 |
365 |
Two conventions are already visible in the table and need stating before any ratio is calculated. First, the denominator is net credit sales: it excludes cash sales and excludes VAT/sales tax, because a balance can only be measured against the flow that creates it, and cash sales never become receivables. Second, the day count is actual days (365 for the year; 90, 91, 92 and 92 for the quarters). Some analysts use a 360-day convention — that is a reporting choice, not arithmetic, and it shifts every result by roughly 1.4%, so say which you use. Before reading on, predict: does Halden collect on time, early or late relative to Net 60?
The year-end snapshot says “early”
The most common published formula pairs the closing balance with the full year’s sales:
=D8/B9*C9 → 640 ÷ 6,000 × 365 = 38.9 daysAgainst Net 60 terms, 38.9 days looks like customers paying three weeks early. The conventional fix — averaging
opening and closing balances — barely moves it: =(D4+D8)/2/B9*C9 gives 37.7 days. Both numbers rest on the
same instant: a receivables balance taken at the deepest point of the seasonal trough.
Use every available balance instead. Averaging all five observations and keeping the same annual denominator —
=AVERAGE(D4:D8)/B9*C9 — gives 58.9 days, a different story: collections sitting right on terms, not beating
them. Cross-check it the second way: receivables turnover is =B9/AVERAGE(D4:D8) = 6.2x per year, and
365 ÷ 6.2 returns 58.9 days — the two routes agree, which is what makes the number worth reporting.
Why such a gap? Because receivables at any instant reflect the sales pace of the weeks before it, not the
year’s average pace. Q4 invoices arrive at 800 ÷ 92 = 8.7 a day, less than a third of Q2’s 28.6, so the
December balance is small because little was sold, not because customers paid quickly. Divide that small balance
by the full-year average pace of 6,000 ÷ 365 = 16.4 per day and DSO flatters itself.
Match the periods, and the trend appears
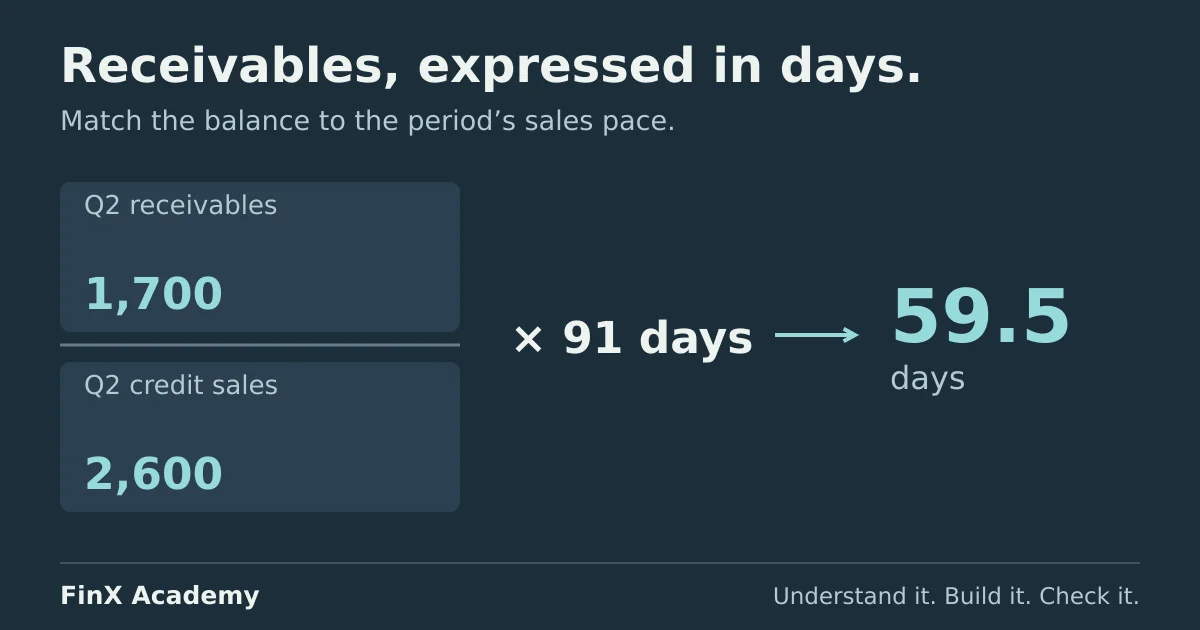
The honest quarter-by-quarter measure pairs each balance with that quarter’s sales and days: =D/B*C row by
row:
| Quarter | Matched DSO |
|---|---|
| Q1 | 67.5 days |
| Q2 | 59.5 days |
| Q3 | 65.7 days |
| Q4 | 73.6 days |
Now the year-end figure is exposed as calendar luck — the 38.9-day snapshot came from a business whose actual collections had deteriorated to 73.6 days, thirteen past terms, during the very quarter the flattering snapshot was taken. This is the seasonality diagnostic in one step: whenever DSO from an annual pairing looks far better or worse than the payment terms can explain, recompute it on a period matched to the balance. For a non-seasonal business the pairings converge and the annual formula is fine; for Halden it is not. (Wall Street Prep’s DSO guide notes the same seasonal exception to its default ending-balance formula.)
A second warning sign hides in the same table: a healthy Q2 (59.5) can compensate a bad Q4 (73.6) inside any average. The five-point average says 58.9 — the truth it encodes is “on terms on average, slipping by year-end.” State both numbers, not one.
Turn the day-count into a forecast receivables balance
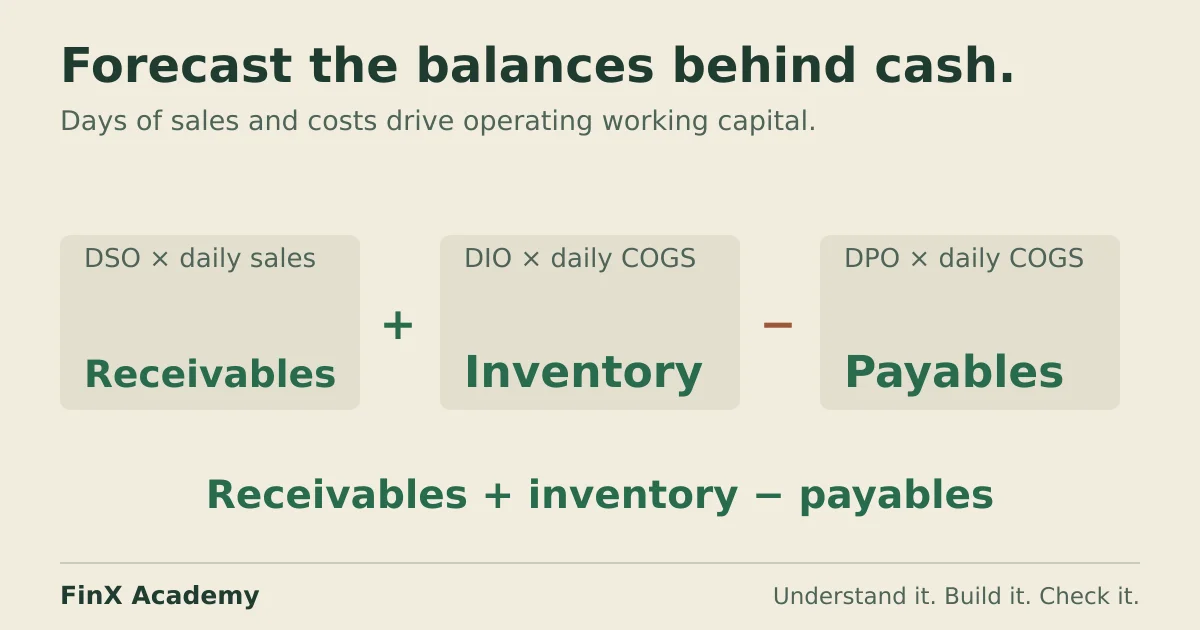
Forecasting is the calculation run backwards. The working-capital schedule guide forecasts each operating balance from a driver; for receivables the driver is the DSO you can defend, and the balance is simply daily sales times that many days:
forecast receivables = forecast credit sales ÷ days in period × target DSOHalden’s FY2026 plan carries net credit sales of 6,800, and management commits to pulling collections back to
55 days by year-end. Enter 6,800 in B12 and 55 in B13, with labels in column A. The forecast closing
balance is =B12/365*B13 →
6,800 ÷ 365 × 55 = 1,024.7. Change one input to see what is at stake: if collections hold at 65 days
instead, the balance is 1,211.0 — an extra 186.3 tied up in invoices. Against the actual 31 December
2025 balance of 640, the 55-day plan means receivables rise by 384.7 over the forecast year, and every
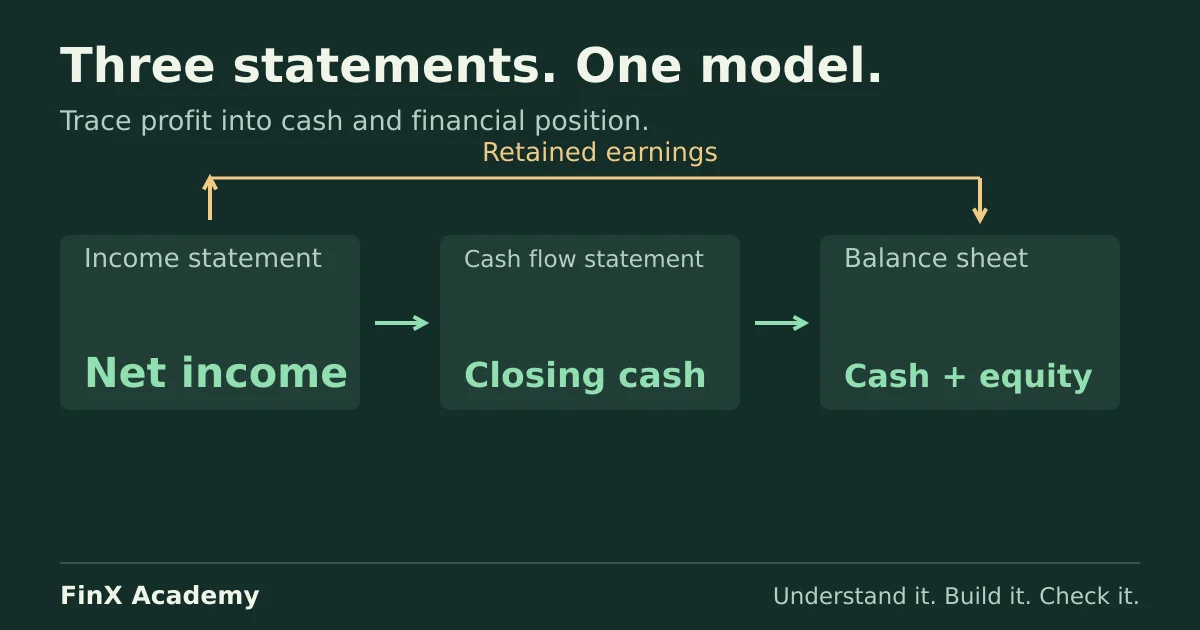
increase in an operating balance is an equal use of cash in the free cash flow bridge
and the cash-flow statement — sign conventions belong to the working-capital guide, but the sensitivity belongs
to the day-count you chose.
Three checks make the forecast trustworthy: the balance scales linearly with sales (a 10% sales miss at fixed DSO releases about 10% of the balance); the assumed DSO must be defensible against the matched-quarter history, not just the annual average — 55 days is a promise, since Halden has never averaged below 59.5; and term changes break the link (loosening Net 60 to Net 90 raises DSO without anyone collecting slower).
Three ways the number goes wrong
1. The denominator includes cash sales. If Halden’s 6,000 of credit sales is part of 7,500 of total revenue
and you divide by the total, the year-end DSO falls to 640 ÷ 7,500 × 365 = 31.1 days. The error is
one-directional — inflated sales always shrink the ratio — and it points every report the same flattering way.
2. The balance is an instant presented as a convention. 38.9, 37.7 and 58.9 are all “correct” formulas; they answer different questions. Quoting the trough snapshot as the DSO without saying which balance and which denominator were used is how a 20-point miss becomes a trend “improvement” in the next deck.
3. The forecast is built on the wrong base. Pairing the annual target DSO with a single quarter’s sales gives
1,400 ÷ 365 × 55 = 211.0 as a “Q3 balance” — mixing paces, exactly the mistake above at forecasting time. Use
the forecast period’s own daily sales; a quarter balance uses quarter days.
Check your answers
- Period-end/annual DSO: 38.9 days; opening–closing average: 37.7; five-point average: 58.9 (turnover 6.2x, and 365 ÷ 6.2 = 58.9 ✓).
- Matched-quarter DSO: 67.5 / 59.5 / 65.7 / 73.6 — deterioration masked by the year-end trough.
- Forecast FY2026 receivables: 1,024.7 at 55 days; 1,211.0 at 65 days; difference 186.3. Increase over the 2025 closing balance at 55 days: 384.7 of cash absorbed.
- Cash-sales mistake: 31.1 days — understated because the denominator grew.
Take the next step
The balance you forecast here becomes one line of a working-capital schedule, where DSO, DIO and DPO drivers meet the cash sign of their changes, and one input of the cash conversion cycle, which reads the same year backwards — DIO and DPO are defined there, not here; the three-statement model guide shows where the receivables movement lands in the statements, and balance sheet not balancing walks through a period where rising receivables explain the gap between profit and cash. FinX’s Three-Statement Build course includes a paid working-capital lesson where you build DSO, DIO and DPO drivers into one integrated model — browse the catalogue for the current syllabus. The free ten-minute diagnostic asks five numeric modelling questions; it is not a ratios quiz and does not time your collections.
Continue with guided practice
Connect the schedules in one integrated income statement, balance sheet and cash flow model. Explore The 3-Statement Build syllabus and start with a free lesson.
The 3-Statement Build course