The cash conversion cycle is DIO + DSO − DPO: the days your cash is tied up between paying suppliers and collecting from customers. State the balance convention, day count and daily flows, then verify the days by converting them back to cash.
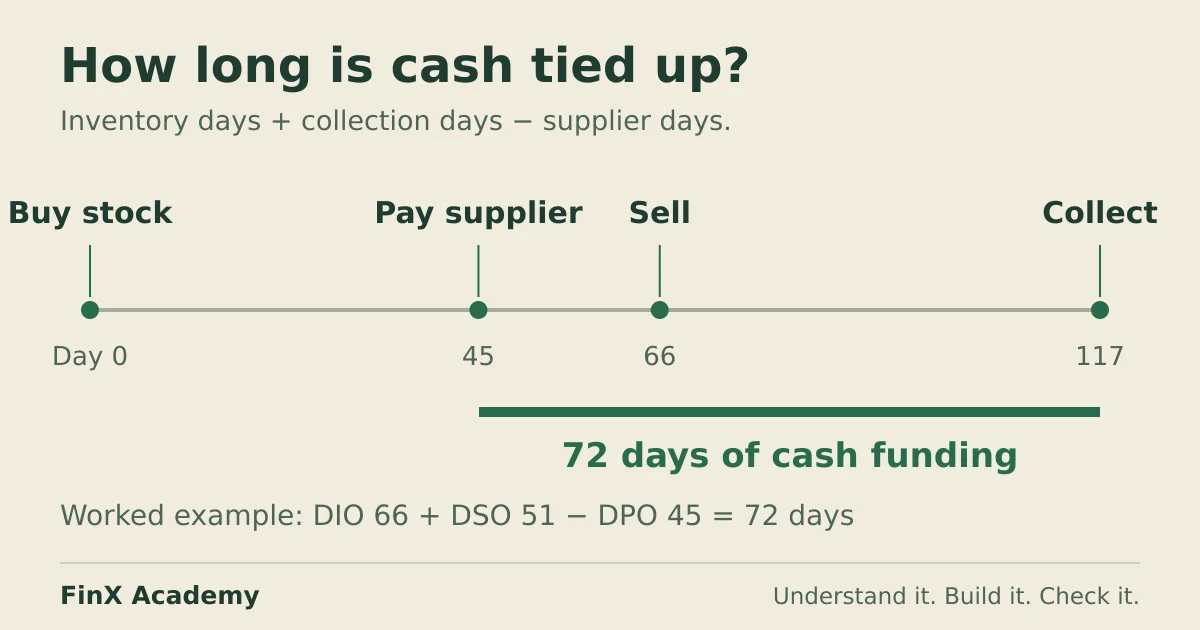
Cash conversion cycle = DIO + DSO − DPOThe cash conversion cycle (CCC) counts the days for which a business must fund its own operations: it buys and holds inventory (days inventory outstanding, DIO), sells on credit and waits to collect (days sales outstanding, DSO), and only later pays suppliers (days payable outstanding, DPO). Inventory days plus collection days is the operating cycle; supplier credit covers part of it, so the payable days are subtracted. A 72-day cycle means cash leaves for stock and returns, net of what suppliers financed, about 72 days later.
Two cautions before the numbers. First, published definitions disagree quietly about conventions — average versus closing balances, 365-day versus 360-day years — and both choices change the answer for the same financial statements. Second, “days” is not “cash”: the useful management question is what a longer cycle costs, which needs the daily flows behind each leg. Both are part of the worked example.
Read the three legs from one set of financials
The example is fictional: a small distributor’s last fiscal year, in one illustrative currency, with the convention stated up front — closing balances from the year-end balance sheet, a 360-day year, and all sales on credit. The working capital schedule guide forecasts these same three balances forward from day drivers; here we read them backwards out of the statements to measure the year that already happened.
| Cell | Label | Amount |
|---|---|---|
| B2 | Days in the year (convention) | 360 |
| B3 | Revenue (all on credit) | 36,000 |
| B4 | Cost of goods sold | 21,600 |
| B6 | Accounts receivable, year end | 5,100 |
| B7 | Inventory, year end | 3,960 |
| B8 | Accounts payable, year end | 2,700 |
Receivables, inventory and payables are balance-sheet items; revenue and cost of goods sold come from the income statement — the SEC’s introduction to financial statements explains how the statements divide that labour. Now the three day-count formulas:
| Metric | Formula in column B | Result |
|---|---|---|
| DSO (B10) | =B6/B3*$B$2 |
51.0 days |
| DIO (B11) | =B7/B4*$B$2 |
66.0 days |
| DPO (B12) | =B8/B4*$B$2 |
45.0 days |
| CCC (B13) | =B11+B10-B12 |
72.0 days |
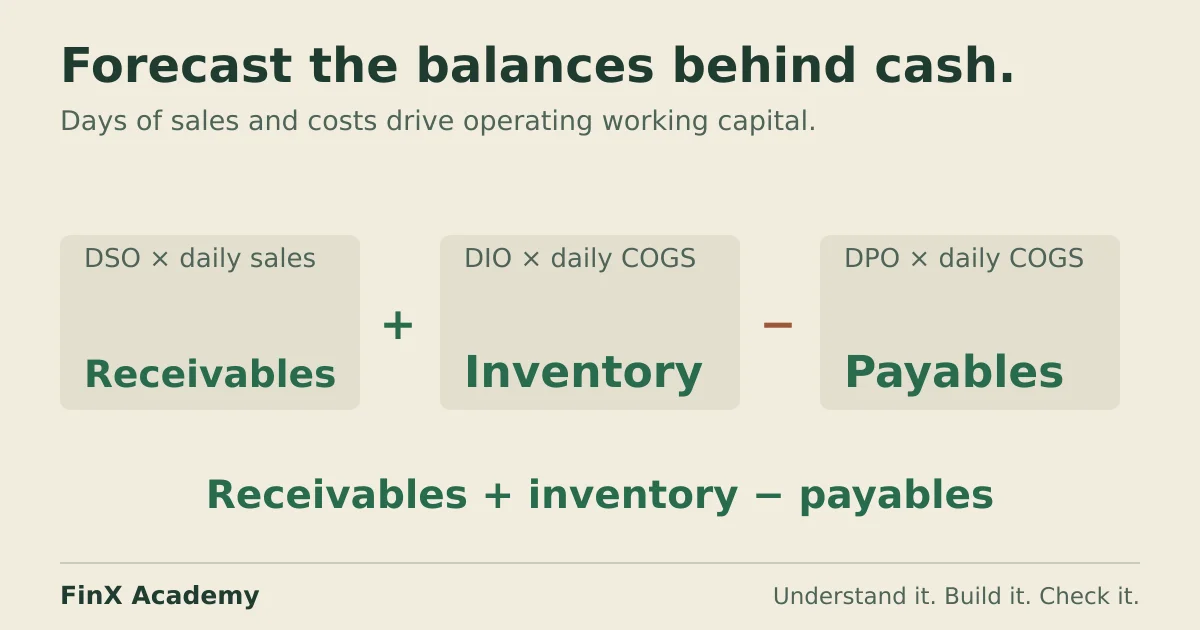
Predict before you type: 36,000 of revenue over 360 days is 100 per day, so 5,100 of receivables is
exactly 51 days of sales sitting uncollected. Each day of DIO and DPO is instead 21,600 ÷ 360 =
60, because inventory and payables are carried at cost. Note the *$B$2: all three day-count
formulas pin the same cell, so changing the convention once moves all four answers together.
State the convention, or the answer drifts
Explanations of this metric use two different balance conventions — average of opening and closing, or closing only — often without flagging which one they chose. Both are legitimate; the same year gives both answers:
| Convention | DSO | DIO | DPO | CCC |
|---|---|---|---|---|
| Closing balances (above) | 51.0 | 66.0 | 45.0 | 72.0 |
| Average balances, with 4,500 opening AR, 3,600 inventory, 2,400 AP | 48.0 | 63.0 | 42.5 | 68.5 |
Three and a half days, same company, same year. The average-balance version pairs each closing balance with its opening figure — average the two balances, then divide by the same flow and multiply by the same day count — and answers “what did a typical day of this year look like?”; the closing version answers “what will tomorrow’s cash position start from?”, which makes it the natural starting point for a forecast. Whichever you choose, write it in a label cell like the 360 above, and never compare your number to a source that has not stated its own. The 365-versus-360 day count is the same species of silent choice: DSO computed on 365 days comes out 51.7, and mixing day counts across the three legs compounds a convention error with a units error. The receivables leg has a deeper story of its own — why a year-end snapshot flatters a seasonal business — on the days sales outstanding guide.
Convert days to cash: the downside costs money, exactly
Days are the diagnosis; cash is the consequence. With the two daily flows already computed — 100
of revenue per day, 60 of cost per day — each leg converts back to money: 51 days of DSO × 100 =
5,100 of receivables, 66 × 60 = 3,960 of inventory, 45 × 60 = 2,700 of payables, so the business
funds 5,100 + 3,960 − 2,700 = 6,360 of net operating working capital. Resist the tempting
shortcut 72 days × some daily flow: the legs run on different flows, so there is no single
daily number that reproduces 6,360 from 72 days.
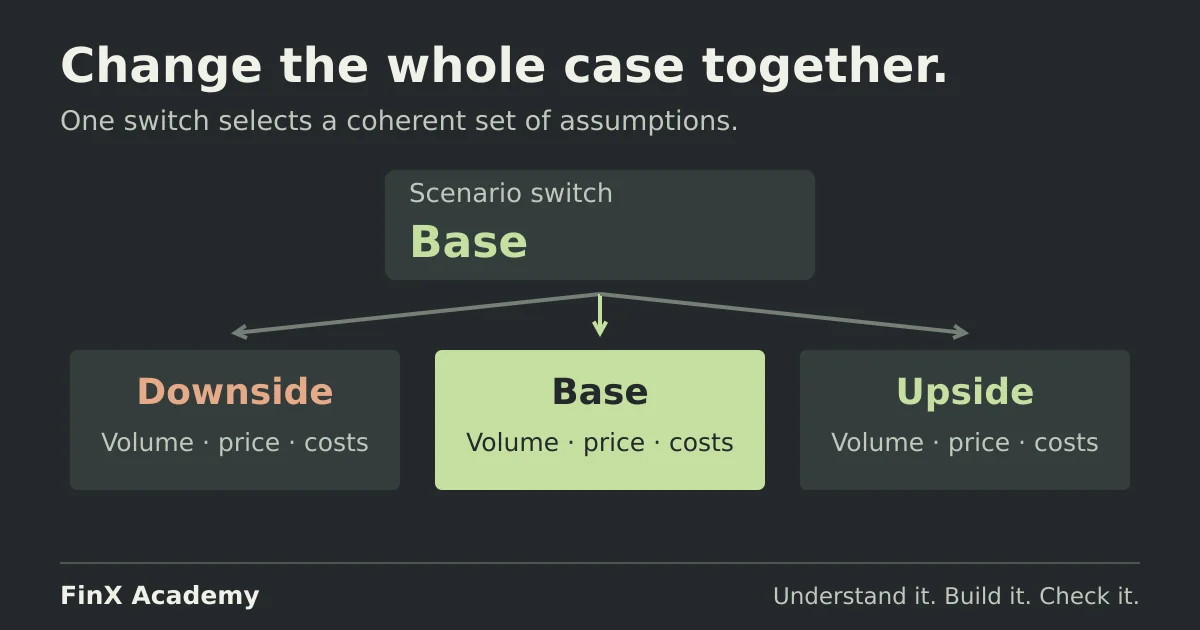
Now the credit-case downside: customers stop paying on time (DSO 51 → 60), demand softens and stock sits longer (DIO 66 → 75), and suppliers, spooked, tighten terms (DPO 45 → 36). The cycle:
CCC downside = 75 + 60 − 36 = 99 days (+27 days)Because all three drivers moved together as one coherent story, the balances follow: 60 × 100 = 6,000 receivables, 75 × 60 = 4,500 inventory, 36 × 60 = 2,160 payables. Net funding becomes 6,000 + 4,500 − 2,160 = 8,340, which is 1,980 more than the base year — the cash number behind the “+27 days”, from 900 for slower collections, 540 for the extra stock and 540 for paying suppliers earlier. A lender or a debt schedule cares about 1,980; the 72-versus-99 days is how you explain it. This is a scenario in miniature: assumption bundles, not single-input nudges — and for the one-at-a-time version, the sensitivity guide builds the grids.
The two mistakes the checks catch
Wrong base. The realistic slip is computing DIO on revenue: =B7/B3*$B$2 gives 39.6 days, and
the CCC prints 45.6 — 26.4 days shorter, and ready to be benchmarked against any industry
average with a straight face. The arithmetic never errors, so re-derive the balance through the
definition’s own flow: DIO days are cost days, so multiply by 60 a day. The correct 66 returns
3,960 ✓; the wrong 39.6 returns 2,376, which is not the inventory on the balance sheet.
(Dividing back by revenue would “confirm” the wrong figure — the check works because it re-crosses
a different path, not the same one.) Run the same conversion on all three legs, plus the sign
check that DPO is subtracted: =B10+B11+B12 prints 162 days for this example, an absurd number
that survives review more often than it should.
Missing opening balance. In the average convention, a blank opening cell never raises an error;
what it does depends on how you wrote the average. (opening + closing)/2 treats the blank as zero
and halves the balance: leave opening receivables empty and DSO falls from 48.0 to 25.5 days.
AVERAGE(opening, closing) skips the blank and returns the closing balance alone, so that leg silently switches to the closing convention while the others
stay averaged. Neither prints anything wrong-looking, so check that every opening cell is filled
before trusting the cycle. Decide the convention before entering data, the same discipline the
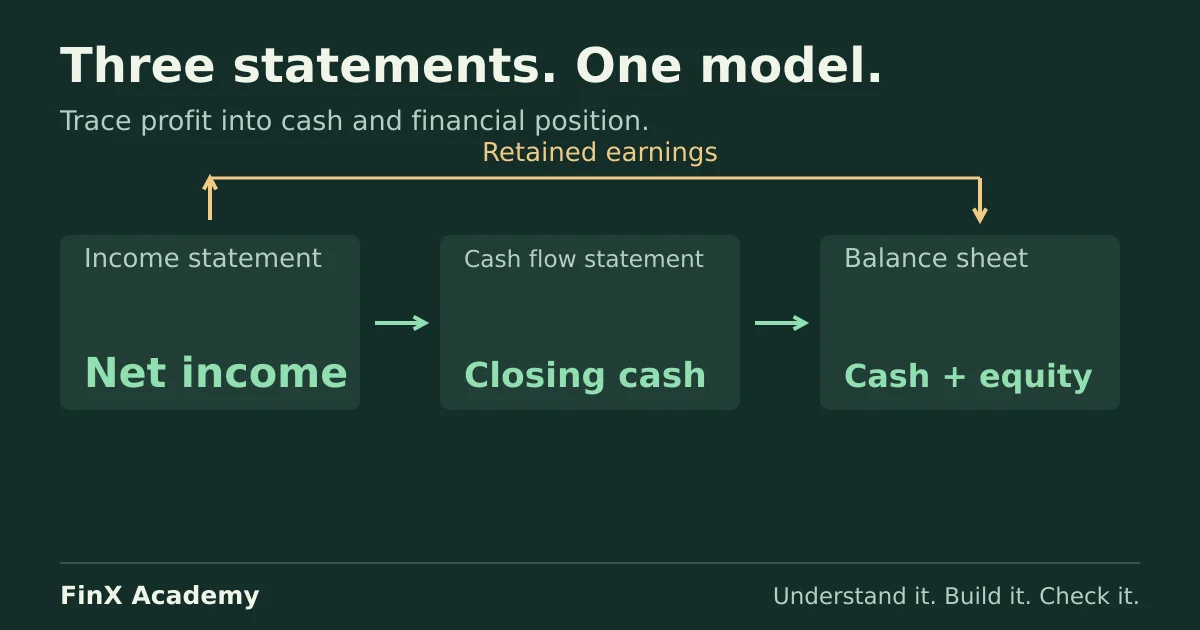
3-statement model applies when it reconciles each schedule back to the
balance sheet.
A shorter cycle is not automatically better
Stretching payables from 45 days to 60 would cut this cycle by 15 days and fund 900 less — and might cost a supplier discount, a price increase or the relationship. Collecting receivables faster shortens the cycle but can push customers to a competitor that offers looser terms. The cycle is a leverage map, not a scoreboard: the honest reading of this example is “the downside’s 27 extra days are 1,980 of funding”, weighed line by line against what it costs to buy each day back.
Next practice step
You now have the cycle read from the statements and converted into cash. The other direction is where models live: the working capital schedule guide forecasts receivables, inventory and payables from day drivers and catches the wrong-base error with implied-days checks — build that next and the two articles meet at the same three rows of the balance sheet. For the full connected model, see the three-statement model.
In FinX’s Three-Statement Build course, the working-capital lesson wires these drivers into an integrated model; it requires paid access. Browse the catalogue for the current syllabus and pricing, or try the free five-question diagnostic to find the skill to practise next.
Continue with guided practice
Connect the schedules in one integrated income statement, balance sheet and cash flow model. Explore The 3-Statement Build syllabus and start with a free lesson.
The 3-Statement Build course