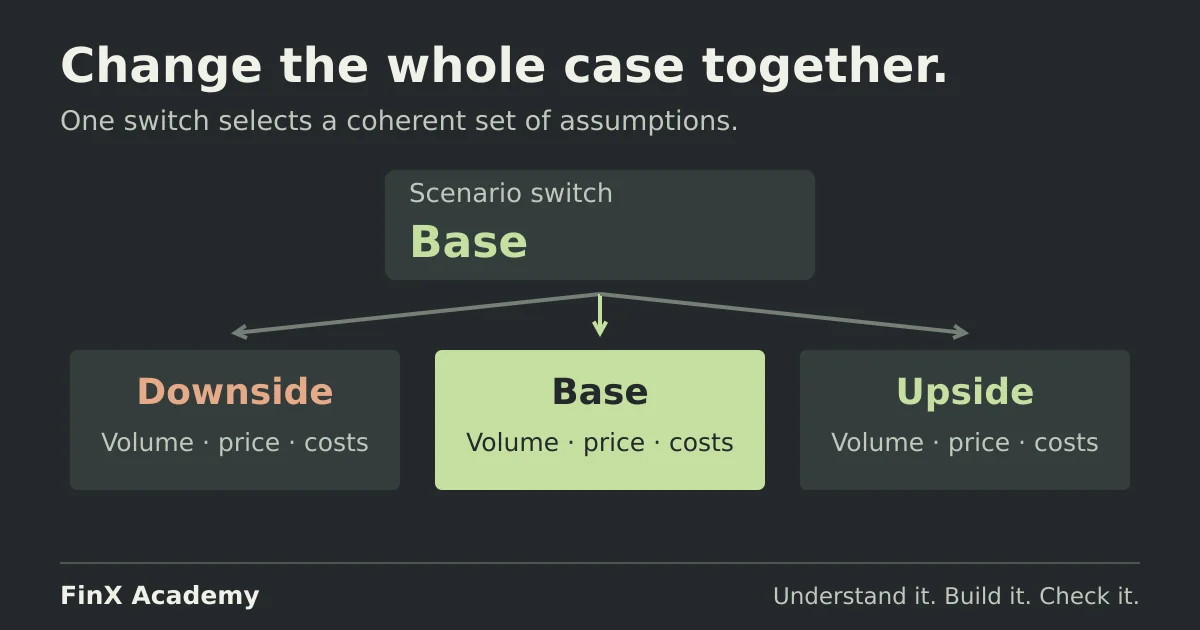
A scenario is a set of assumptions that travel together. Drive every input from one switch, check each case by hand, and reconcile the live column against the case columns so a typed-over cell cannot masquerade as a base case.
Scenario analysis asks what the model says when several assumptions change together, as one
coherent story: management’s plan, the optimist’s plan and the credit case. In Excel you can build
it with ordinary formulas: type the cases side by side in a block, pull the selected case into a
single live column with one INDEX formula, and let one switch cell drive the whole model. The
model itself never asks which case it is in; it reads the live column and nothing else.
That last property is the point. A revenue growth rate of 15% belongs with a 38% gross margin; a 2% growth rate belongs with 31%. If you edit the model’s inputs directly every time you want a new case, you will eventually test a combination that describes nobody’s plan. The switch structure makes mixing cases a thing a check can catch, rather than a thing that ships.
Scenario or sensitivity? Answer a different question
The two are related, and teams use the labels loosely, so it is worth separating them before building anything:
| Sensitivity analysis | Scenario analysis | |
|---|---|---|
| What moves | One or two inputs at a time, across a range | A bundle of inputs, moved together |
| The question it answers | “How much does the result depend on this assumption?” | “What does the business look like if this story happens?” |
| Typical shape | A grid of trial values | Two or three named cases: base, upside, downside |
| Assumption of the method | The other inputs hold (“all else equal”) | The other changes are correlated on purpose |
Holding everything else constant is exactly what makes a sensitivity grid interpretable — and exactly what makes it unrealistic for a boom or a slump, where growth, margin and spending move together. The interest coverage guide works a downside EBIT case by hand; here the whole model switches.
Enter the three cases
The example is fictional: one year of a small distributor’s forecast, in one illustrative currency. Last year’s revenue is 10,000. Three cases differ in three drivers:
| Cell | A: Driver | C: Live | D: Base | E: Upside | F: Downside |
|---|---|---|---|---|---|
| 5 | Revenue growth vs prior year | (formula) | 8% | 15% | 2% |
| 6 | Gross margin | (formula) | 35% | 38% | 31% |
| 7 | Fixed operating costs | (formula) | 1,200 | 1,250 | 1,200 |
Type the labels in A4:A7 and C4:F4 (Live, Base, Upside, Downside), the nine case values in
D5:F7, then Prior-year revenue in A9 and 10,000 in C9. The Upside case spends more fixed cost (1,250) because its growth is
bought with marketing; the Downside case holds costs at 1,200. Those are the stories — each column
should be defensible as one person’s plan, not a grab bag of extremes.
Put the switch in C2, beside a label like Case (1=Base, 2=Upside, 3=Downside), and enter 1.
Wire one switch to every driver
Enter this formula in C5 and copy it down to C7:
=INDEX($D5:$F5,$C$2)INDEX returns the nth item
of a range, where n comes from the switch. INDEX($D5:$F5,1) is Base, 2 is Upside, 3 is
Downside. The anchoring is the exercise, because the two parts must behave differently when you
copy down:
$C$2— fully anchored. Every row reads the same switch cell.$D5:$F5— columns anchored, row free. The range walks down from the growth row to the margin row while staying inside the case block.
The absolute-reference guide works through exactly this copy-down
behaviour. Read the formula in the last cell you copied — C7 should read =INDEX($D7:$F7,$C$2),
not C2, and not $D$5:$F$5 on every row.
Then the forecast reads the live column only. Enter in C10:C12:
=C9*(1+C5)
=C10*C6
=C11-C7
Label them Year 1 revenue, Gross profit and Operating profit in A10:A12. With the switch on 1, all
three live cells should show the Base values: 10,800, 3,780.00, 2,580.00.
Check each case by hand
Predict before you switch — the check is the mental arithmetic, not the spreadsheet.
- Base (switch 1): 10,000 × 1.08 = 10,800; 10,800 × 0.35 = 3,780; 3,780 − 1,200 = 2,580.
- Upside (switch 2): 10,000 × 1.15 = 11,500; 11,500 × 0.38 = 4,370; 4,370 − 1,250 = 3,120.
- Downside (switch 3): 10,000 × 1.02 = 10,200; 10,200 × 0.31 = 3,162; 3,162 − 1,200 = 1,962.
Switch to 2, then to 3, and compare the outputs against those predictions. Then check the
relationship: the base case should beat the downside and trail the upside on all three lines, so
the ordering downside < base < upside must hold for revenue, gross profit and operating profit
(1,962 < 2,580 < 3,120). If the order flips on one line only, the columns are not consistent
stories and the case labels are doing no work. Finally, set the switch back to 1 and confirm
C12 returns to 2,580.00.
A switch that lies: the mixed case
Here is the failure the structure is designed to catch. A colleague wants to see the margin effect
alone, types 0.38 directly over the formula in C6, and leaves the switch on 1. C12 now shows
2,904.00 — between the base 2,580 and the upside 3,120, so it looks like a plausible
“in-between case”. It is not a case; it is base growth and base costs wearing the upside margin,
and the model still calls itself Base.
You could find it by reading every live cell. Better, make it self-reporting: enter in C14 and
copy down to C16:
=IF(C5=INDEX($D5:$F5,$C$2),"ok","MIXED — live cell overwritten")While the live cells hold the switch formulas, the comparison is between the cell and its own
rule, so it reads ok. It fires precisely when someone types a constant over a live cell,
because then C6 holds 0.38 while the switch still points at column D’s 0.35. With the accidental
overwrite in place, C15 reads MIXED — live cell overwritten; delete the typed 0.38, restore
=INDEX($D6:$F6,$C$2), and all three checks read ok again. Keep the checks next to the block
where a reviewer will see them, and never “fix” a MIXED flag by typing the case value into the
check’s expected side.
The native alternative, briefly
Excel’s own tool for this is the Scenario Manager (Data → What-If Analysis → Scenario Manager), which saves sets of changing-cell values and swaps them in for you; Microsoft documents it for desktop Excel in Switch between various sets of values by using scenarios and Introduction to What-If Analysis. It is a real workflow and worth knowing by name, but the saved values are invisible until someone opens the dialog — the model on screen does not show which case it is displaying, and the case table still has to be built to create the scenarios. The formula block above keeps every case on the sheet, visible, with a switch and checks that a reviewer can inspect. The sensitivity guide makes the same trade-off between formula grids and the native Data Table. Do not assume the What-If tools exist in Excel for the web or in other spreadsheet engines; the formulas above do not need them.
Next practice step
One switch, an anchored INDEX per driver, hand-calculated predictions per case, and a live-versus-
case reconciliation — that is the whole technique. If you want to drill the anchoring itself, the
absolute-reference guide is the free companion piece.
In FinX’s Excel for Finance course, the Scenario Switching lesson grades exactly this
assumption-block layout — the switch in C2, the live column and one INDEX per driver — because
the layout is the contract the three-statement build inherits. That lesson requires paid access;
Mathematical Functions and Anchoring & the Grid are free. Browse the
catalogue for current syllabus and pricing, or try the free five-question
diagnostic to find the skill to practise next.
Continue with guided practice
Build on this guide with spreadsheet exercises on formulas, lookups and financial functions. Explore the syllabus and start with a free lesson.
Excel for Finance course