A correct first cell is only the beginning. A reliable formula must still point to the right inputs after you copy it.
An absolute reference keeps both the row and column fixed when you copy an Excel formula. A mixed reference fixes only one of them. The dollar sign is the instruction: $B$3 keeps both coordinates fixed, while B3 moves relative to the formula’s new position.
That distinction matters in a financial model because you rarely write every formula individually. You write one, copy it across a forecast, and expect it to keep working.
Start with the four reference types
| Reference | What stays fixed | What changes when copied |
|---|---|---|
B3 |
Nothing | Both row and column can move |
$B$3 |
Row 3 and column B | Neither coordinate |
$B3 |
Column B | The row can move |
B$3 |
Row 3 | The column can move |
You do not need to memorise four separate tricks. Ask two questions: should the column move, and should the row move? Add a dollar sign before the coordinate that should stay in place.
Microsoft’s reference guide explains the underlying behaviour. The examples below apply it to a small, fictional forecast.
Build a revenue forecast
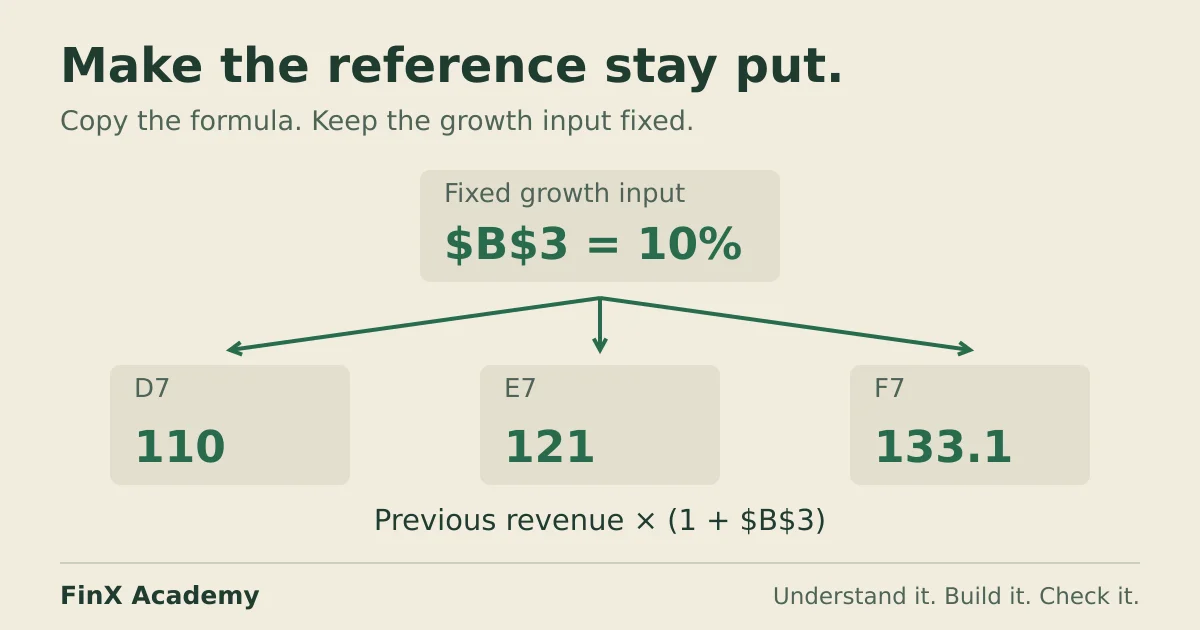
Suppose cell B3 contains an annual growth assumption of 10%. Cell C7 contains the current year’s revenue of 100. You want D7, E7 and F7 to show the next three years.
Enter this in D7:
=C7*(1+$B$3)Copy it to the right. The reference to the previous year’s revenue should move, but the growth assumption should remain in B3.
| Cell | Formula after copying | Result |
|---|---|---|
| D7 | =C7*(1+$B$3) |
110 |
| E7 | =D7*(1+$B$3) |
121 |
| F7 | =E7*(1+$B$3) |
133.1 |
These are illustrative figures, not a forecast for a real business.
Now consider =C7*(1+B3). The first answer is still 110. But when you copy it from D7 to E7, the assumption reference becomes C3. If that cell is blank, Excel treats it as zero in this calculation and the forecast stops growing. Checking only the first result would miss the problem.
Use mixed references for a grid
Mixed references are useful when assumptions run across a row and down a column.
For a simple illustration, put quantities of 10 and 20 in B6:B7, and prices of 5 and 6 in C5:D5. To calculate revenue for each combination, enter this in C6:
=$B6*C$5Copy across and down.
$B6always takes the quantity from column B. Its row changes as you move down.C$5always takes the price from row 5. Its column changes as you move right.
The resulting grid should contain 50 and 60 in the first row, then 100 and 120 in the second. This tiny example teaches the same reference discipline needed for larger modelling grids.
For a complete price-and-volume example, build the Excel sensitivity grid and check its centre and corner cells.
Check the formula, then the result
A useful check has three parts:
- Inspect the formula in the first cell.
- Inspect a cell at the far right or bottom after copying.
- Change one input and confirm that all the intended outputs respond.
If you set the growth assumption in the earlier forecast to zero, all forecast revenues should stay at 100. If some change and others do not, inspect where those formulas point.
A common overcorrection is to make every reference absolute. In the forecast, fixing $C$7 as well as $B$3 would calculate every future year from the same starting revenue. That also defeats the intended model.
Put the reference habit into practice
FinX’s Anchoring & the Grid lesson is part of the selected free Excel content. Browse the course catalogue and open that lesson to practise copying formulas with feedback. The catalogue shows the current free and paid boundaries.
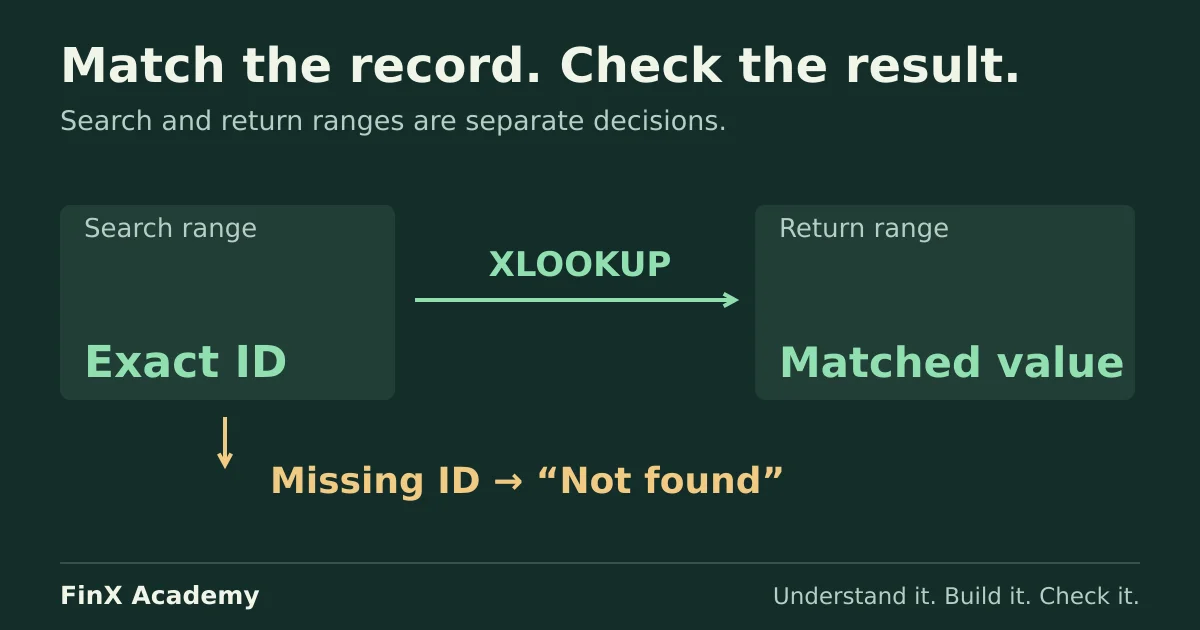
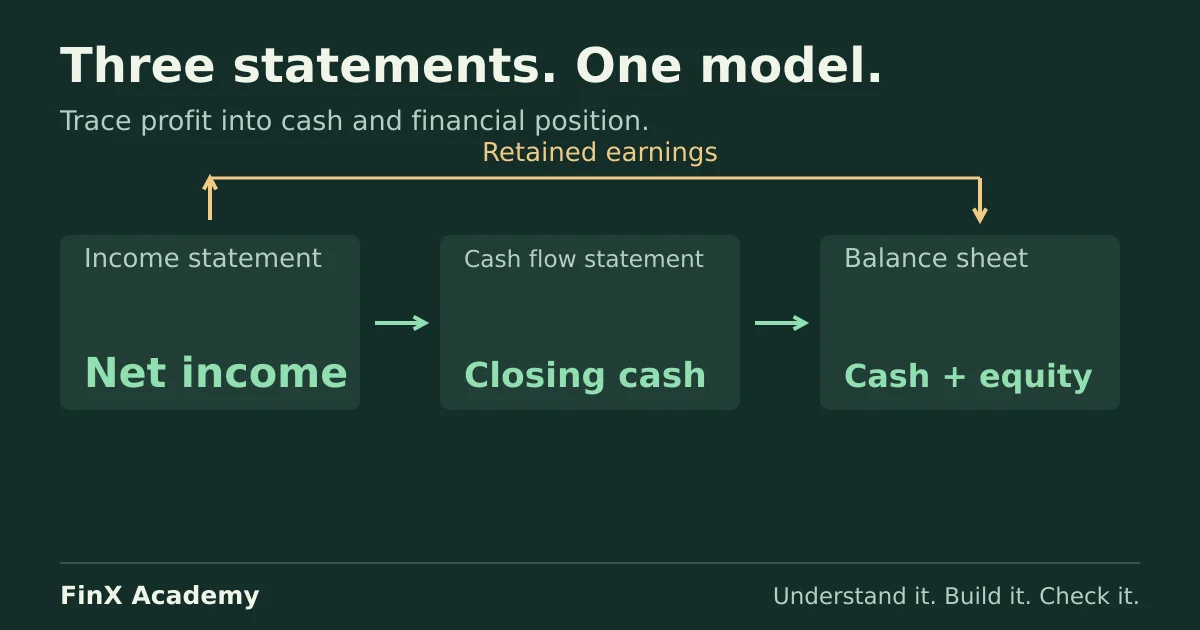
Once references are clear, work through XLOOKUP practice. If you want to see how individual formulas connect across a larger model, continue to the three-statement guide.
Try the revenue forecast
Change B3 from 0.10 to 0.20. D7:F7 should become 120, 144 and 172.8. Set it to zero to get 100 in every forecast year.
An editable example using the same spreadsheet as FinX lessons. Reset or close it to start again. Your changes are not saved.
Continue with guided practice
Build on this guide with spreadsheet exercises on formulas, lookups and financial functions. Explore the syllabus and start with a free lesson.
Excel for Finance course