WACC is a weighted blend of what lenders and shareholders require, not a number to borrow. Build it from market-value weights, apply the tax shield only where it is actually used, and check the answer sits between its two parts.
The weighted average cost of capital is the return that all of a company’s capital providers require, weighted by how much of the business each of them funds. It is the rate that pairs with unlevered free cash flow in a DCF model. The formula itself is quoted everywhere; the arguments are all in the inputs — whose market values, which borrowing rate, what tax treatment, blended how.
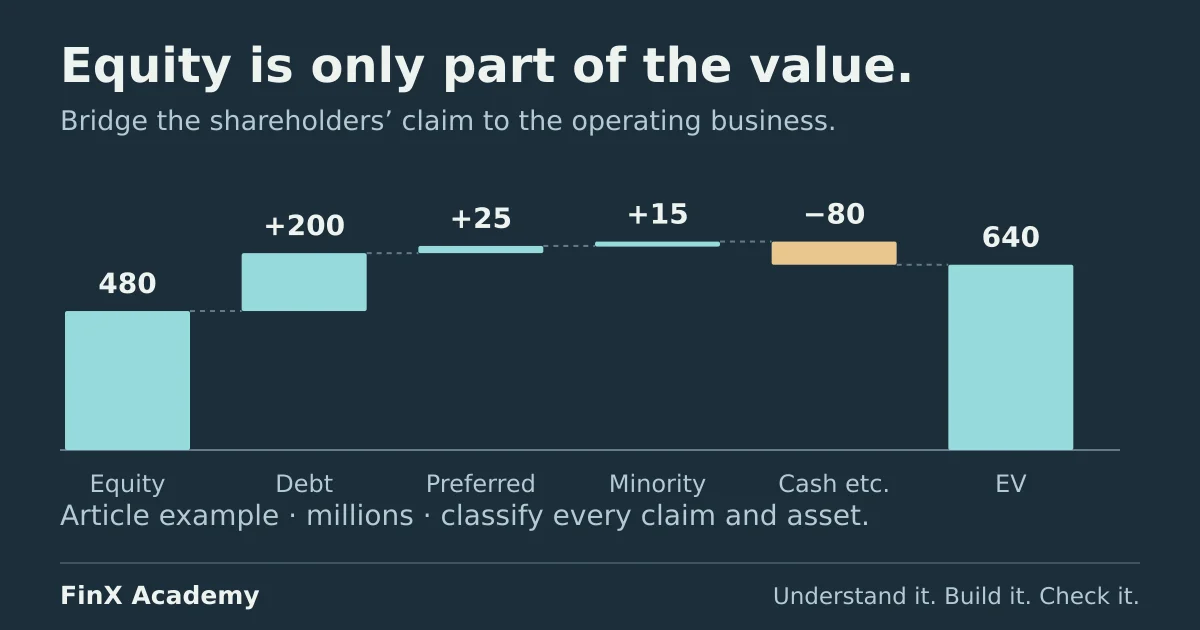
This page assembles a WACC for Northgate Logistics, the fictional company of the valuation-bridge article, which supplies its share price, share count and debt figures, and of the cash-flow bridge, which supplies its interest rate and tax rate. Every figure stays invented; every cell is auditable. Amounts are in millions of one currency.
The formula, and what each part is for
WACC = E/(D + E) × r_e + D/(D + E) × r_d × (1 − t)- E — market value of common equity: share price × shares outstanding, never book equity.
- D — market value of the debt claims on the enterprise.
- r_e — the return equity holders require. In the table below, it comes from CAPM: risk-free rate + beta × equity risk premium. Beta estimation and peer unlevering are their own discipline; this page treats the resulting 10.0% as an assembled input and audits the rest.
- r_d — the cost of new borrowing at today’s rates, not a historical average coupon.
- (1 − t) — interest is tax-deductible, so the after-tax cost to the company is lower; dividends to equity are not deductible, which is why the multiplier sits on the debt term only.
- Weights — market values, because WACC answers “what does it cost to fund this enterprise,” not “how was it funded in the past.”
Enter a transparent assumptions table
Labels in column A, values in column B:
| Cell | Assumption | Value |
|---|---|---|
| B2 | Share price | 24.00 |
| B3 | Shares outstanding (millions) | 20.0 |
| B4 | Market value of equity | =B2*B3 → 480.0 |
| B5 | Market value of total debt | 200.0 |
| B6 | Pre-tax cost of new debt | 5.0% |
| B7 | Corporate tax rate | 25% |
| B8 | Risk-free rate | 4.0% |
| B9 | Beta | 1.2 |
| B10 | Equity risk premium | 5.0% |
Now the provenance of each row, which is the part a template cannot give you:
- B2, B3, B5 are the valuation-bridge article’s inputs: bank loan 120.0 plus senior notes 80.0 give total debt 200.0, and that page already assumed the claims are at market value. Trading debt at par is a simplification a real build replaces with quoted prices or yields.
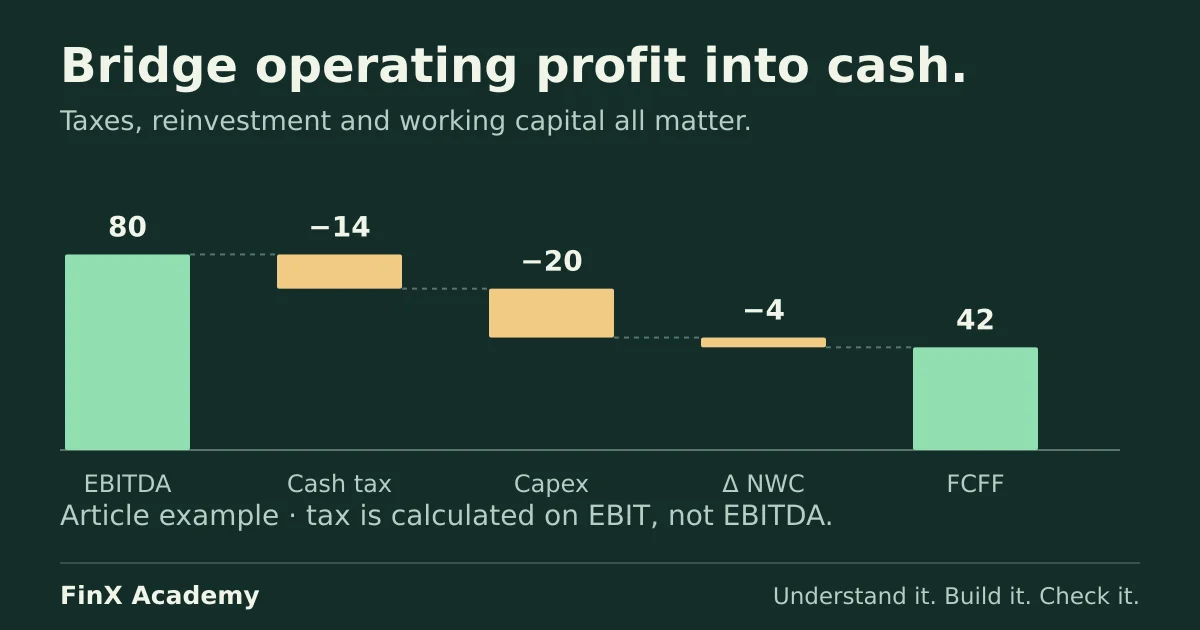
- B6 is the rate Northgate carried its debt at in the cash-flow bridge: 5% × 200.0 = 10.0 of interest, which appears in that article’s levered section. In a live model the cost of debt is the current market yield on new issuance; reusing the financing assumption from the operating model keeps the two statements honest with each other.
- B7 matches the 25% operating cash-tax rate of the same bridge — and note what that phrasing already concedes (see the audit below): a cash rate assumes the deductions are actually used.
- B8–B10 are stated guesses. A real build replaces them with dated evidence — a long-horizon government yield in the cash flows’ currency for B8, and a published, dated premium survey for B10; Damodaran’s cost-of-capital data set is the standard snapshot, and it also shows how differently every industry’s weights and rates land.
One scope decision, stated plainly: Northgate’s bridge also showed 25.0 of preferred shares and 15.0 of minority interest. Those claims are excluded from the two-component WACC below, the same simplification the DCF example declares when it prices the enterprise on a single debt figure and excess cash. A full build either gives every claim a cost and a weight or reconciles against the bridge, so that the excluded claims are not valued by accident in both places.
Assemble the rate
| Cell | Row | Formula | Result |
|---|---|---|---|
| B12 | Cost of equity (CAPM) | =B8+B9*B10 |
10.0% |
| B13 | After-tax cost of debt | =B6*(1-B7) |
3.75% |
| B14 | Total capital | =B4+B5 |
680.0 |
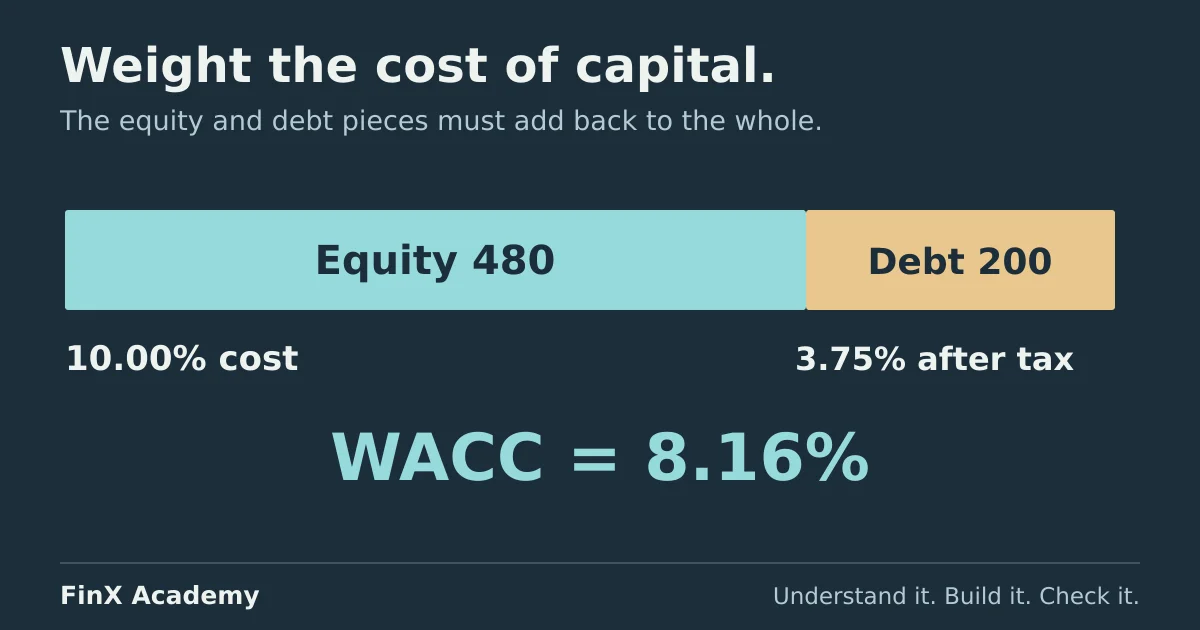
| B15 | Equity weight | =B4/B14 |
70.59% |
| B16 | Debt weight | =B5/B14 |
29.41% |
| B17 | WACC | =B15*B12+B16*B13 |
8.16% |
Before reading on: Northgate is roughly 70/30 equity/debt, the parts are 10.0% and 3.75%. The answer must lie between them, nearer the 10.0 — anything outside that range is a wiring error, whatever the formula says.
The exact blend is 0.70588 × 10.0% + 0.29412 × 3.75% = 8.1618%. Display two decimals, but never type a rounded
rate — 8%, 8.2% — into the discounting cells; the terminal-value denominator magnifies rate rounding (below).
Audit it: two routes, three bounds
- Second route. Compute what the capital providers are owed in one year and divide by the capital:
equity
480.0 × 10.0% = 48.0, debt200.0 × 3.75% = 7.5, so=(B4*B12+B5*B13)/B14→55.5 / 680.0 = 8.16%. Same answer by a different path. - Weights sum.
=B15+B16→ 100%. The bridge has a third group of claims, the excluded preferred and minority interests, so 100% holds only for the two-component scope declared above — that scope note is what makes this check meaningful. - Bounds.
B13 ≤ B17 ≤ B12: 3.75% ≤ 8.16% ≤ 10.0% ✓. A WACC outside its own components is impossible for a weighted average whose weights sum to 100%; it comes from weights on different totals or a wrong reference. The bounds test cannot catch swapped weights —29.41% × 10.0% + 70.59% × 3.75%= 5.59% sits inside the range — which is why the proportions deserve their own glance: this company is mostly equity, so the answer sits nearer 10.0%.
Where the rate pairs up
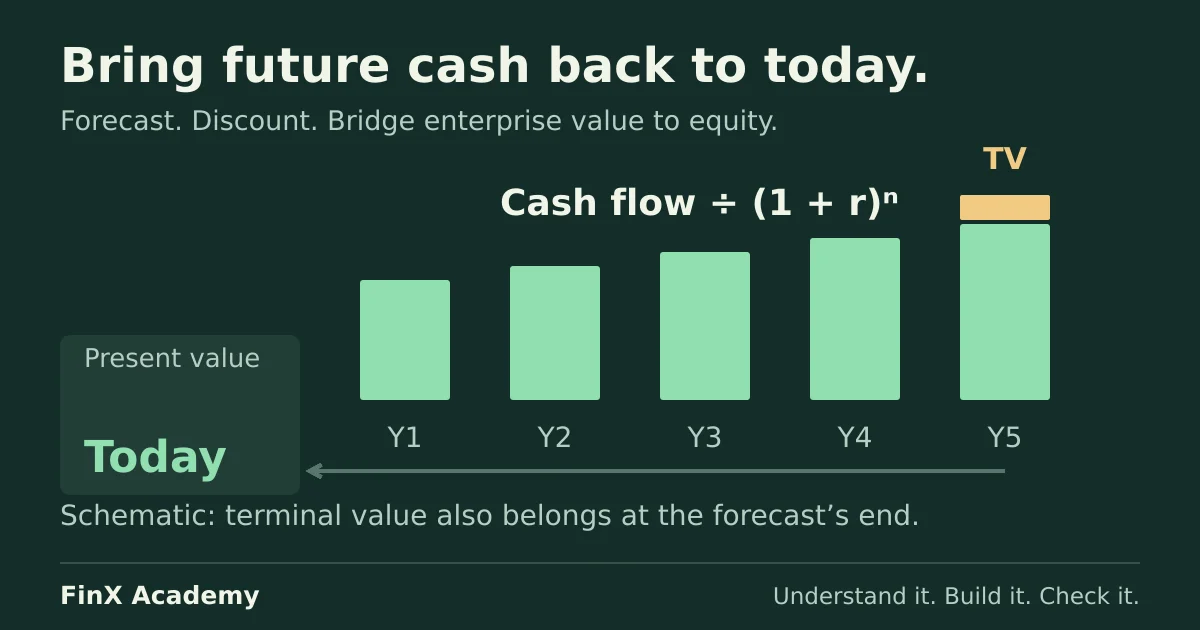
WACC discounts unlevered free cash flow, because it is the blended required return of all providers;
equity-only cash flows pair with B12 and equity value — the matching discipline Damodaran’s
valuation lecture states and both linked
articles apply.
The audit matters most in the terminal value. In the terminal-value guide the
perpetuity denominator is WACC − g; take g = 2%. The correct denominator here is 6.16 points. Forget the tax
shield and it becomes 6.53 — a 0.37-point rate error that cuts the terminal value by about 5.6%. Borrow a round
10% and it becomes 8.00, cutting the terminal value by about 23%. Small-looking rate changes are leveraged by
the denominator, which is why the inputs deserve the table above rather than a constant typed into the discount-rate
cell.
Three ways the assembled rate is wrong
1. The pre-tax debt cost slips in. Replace B13 with 5% and the WACC becomes 7.059 + 1.471 = 8.53% —
overstated by 0.37 points, exactly w_d × r_d × t = 29.41% × 5% × 25%. The twin lesson: 8.53% is also the
correct rate for a company that cannot use the deduction today — losses carried forward, sheltered profits. The
multiplier is worth a line of its own only while the shield is actually collected; state the assumption the same way
this page states the others.
2. Net debt in the weights, gross debt in the bridge. Use the bridge’s net debt of 120.0 instead of gross 200.0 and the debt weight falls to 120/(480 + 120) = 20%, giving 8.75%. Net-debt weights are a convention some practitioners use, not an arithmetic error — but this build weights on gross debt and nets cash in the equity bridge, one step later, and swapping one half without the other leaves the rate and the bridge describing different capital structures. Pick one treatment of cash and state it, the same classification discipline the valuation-bridge article drills.
3. A borrowed rate. Northgate’s cost of equity is 10.0% and the DCF guide supplies its exercise with WACC = 10%. The coincidence is the warning: discounting FCFF at Northgate’s 10.0% prices the cash flows as if the business were all-equity financed, ignoring that lenders demand only 3.75% after tax for their 29.4% of the capital. A supplied rate is a black box until decomposed into weights and component costs — even one that is correctly labelled, as the DCF page labels its own.
Check your answers
- Market equity 480.0; weights 70.59% / 29.41% of 680.0;
r_e10.0%; after-taxr_d3.75%. - WACC 8.16%; second route
55.5 ÷ 680.0agrees; bounds 3.75% ≤ 8.16% ≤ 10.0% hold. - Terminal denominator at g = 2%: 6.16 points; pre-tax error → 6.53 (TV −5.6%); borrowed 10% → 8.00 (TV −23%).
- Error cases: shield forgotten 8.53%; net-debt weights with a gross-debt bridge 8.75%; borrowed 10.0%.
Take the next step
The assembled rate is what the DCF build discounts its five-year FCFF with; the terminal-value guide shows the denominator effect in full and the implied growth check; the cash-flow bridge and the valuation bridge supply this page’s market values and its debt terms. FinX’s Financial Modeling & Valuation course includes DCF practice with paid access — browse the catalogue for the current lessons. The free ten-minute diagnostic asks five numeric modelling questions; it does not grade a cost of capital.
The cost-of-equity guide audits the CAPM inputs and their units. The unlevered-beta guide demonstrates a separately stated net-debt approach; its result must not be dropped into this gross-debt WACC without reconciling the convention. The ROIC guide compares 21.0% operating returns with a supplied 8.16% benchmark in a separately defined teaching variant, and explains the scope and tax checks needed before applying that comparison.
Continue with guided practice
Put the valuation concepts into practice with exercises on financial statements, forecasts and DCF valuation. View the syllabus and try a free lesson.
Financial Modeling & Valuation course