Enterprise value measures the operating business; common equity value is the shareholders' residual. Classify claims and non-operating assets explicitly: a round-trip check tests arithmetic, but shared classification mistakes can still pass it.
Common equity value is the value attributable to common shareholders; for a listed company, market capitalisation is share price multiplied by common shares outstanding. Enterprise value (EV) measures the operating business across its financing claims. A market-value bridge adds debt, preferred shares and relevant minority interests to common equity value, then subtracts qualifying non-operating assets such as excess cash. This page practises deciding which claims and assets belong in that bridge.
The worked example below uses one fictional company, Northgate Logistics, and every number is independently checked. Company values are in millions of one currency, share count is in millions, and share prices are in currency units per share. The comparable-company analysis guide and the DCF model example both use this bridge; here it is the object of practice itself.
Each value answers a different question
Enterprise value prices the operating business for all capital providers — debt holders, preferred holders, minority holders and shareholders together. Equity value prices only the residual left to common shareholders after those claims. That difference dictates which metric pairs with which value:
| Value | Measured against | Typical paired metrics |
|---|---|---|
| Enterprise value | Operating measures before financing costs | EV/EBITDA, EV/revenue, EV/unlevered free cash flow |
| Common equity value | Earnings, cash flows or book equity attributable to common shareholders | P/E, price/free cash flow to equity, price/book |
Pairing a number with the wrong value breaks the comparison: equity value ÷ EBITDA mixes the shareholders’ residual with earnings that belong to all providers, and EV ÷ net income charges interest in the denominator while the numerator still counts the debt claims. Damodaran’s NYU Stern discussion of multiples sets out this matching test; the comps guide cites the same paper.
Set up the fictional company
Enter the label in column A and the input in column B of a blank sheet. All figures are invented:
| Cell | Item | Input |
|---|---|---|
| B2 | Share price | 24.00 |
| B3 | Shares outstanding | 20.0 |
| B4 | Bank loan | 120.0 |
| B5 | Senior notes | 80.0 |
| B6 | Preferred shares | 25.0 |
| B7 | Minority interest in a consolidated subsidiary | 15.0 |
| B8 | Cash and equivalents | 60.0 |
| B9 | Short-term marketable securities | 20.0 |
| B10 | Accounts payable | 45.0 |
| B11 | Deferred revenue | 30.0 |
| B12 | LTM EBITDA | 80.0 |
Assume the debt, preferred and minority-interest inputs are their market values. All 60 of cash is unrestricted and excess to operations, the 20 of securities is a non-operating investment, and EBITDA includes the consolidated subsidiary’s full operating results. There are no leases, convertibles, pension deficits or other adjustments in the numeric example. These assumptions must be checked rather than carried into a real valuation automatically.
Before calculating anything, decide which of rows 4–11 belong as separate adjustments in the bridge. The classification section below is the exercise; rows 10 and 11 test the distinction between operating liabilities and financing claims.
Decide what belongs in the bridge
Classify each item before using it. The first several rows below are mechanical once you know what the item is; the rest require a stated convention, and the point of practising is learning to say which convention you used.
| Item | Treatment | Why |
|---|---|---|
| Bank loan, senior notes | Add to get EV | Interest-bearing funding with a prior claim on the business |
| Preferred shares | Add to get EV | A claim senior to common shareholders and outside the common market cap |
| Minority interest | Add if consolidated results include the subsidiary | EV otherwise omits the outside owners’ share of those earnings |
| Cash and equivalents | Subtract the qualifying non-operating amount | This example assumes all cash is unrestricted and excess to operations |
| Short-term investments | Subtract only if genuinely excess to operations | Same logic as cash, but availability must be assumed, not presumed |
| Restricted cash | Review the restriction and associated obligation | Do not automatically treat it as freely available excess cash; none is present here |
| Finance lease liabilities | Add to get EV | Contractual debt service in substance |
| Operating lease liabilities | Match the lease and earnings conventions | Treat lease liabilities and the operating metric consistently across peers; none is present here |
| Convertible debt | Convention | Either add as debt or assume conversion and use diluted shares — never both |
| Accounts payable, deferred revenue, accrued expenses | Exclude | Operating working-capital items, already embedded in the cash flows the multiple capitalises; see the working-capital schedule guide |
| Pension deficit | Convention | Debt-like for some analysts, operating for others; state which you assumed |
The comps and DCF examples simplify to a single debt figure and excess cash with no preferred shares, minority interests or leases. That assumption set is legitimate when it is declared. This exercise removes the simplification so each claim has to be placed on purpose.
Build the bridge in both directions
Enter these formulas and results, then compare with your prediction:
| Cell | Label | Formula | Result |
|---|---|---|---|
| B15 | Equity value | =B2*B3 |
480.0 |
| B16 | Total debt | =B4+B5 |
200.0 |
| B17 | Cash and excess investments | =B8+B9 |
80.0 |
| B18 | Enterprise value | =B15+B16+B6+B7-B17 |
640.0 |
| B19 | Net debt | =B16-B17 |
120.0 |
| B20 | EV reconstructed via net debt | =B15+B6+B7+B19 |
640.0 |
| B21 | Equity value from EV | =B18-B16-B6-B7+B17 |
480.0 |
| B22 | Implied value per share | =B21/B3 |
24.00 |
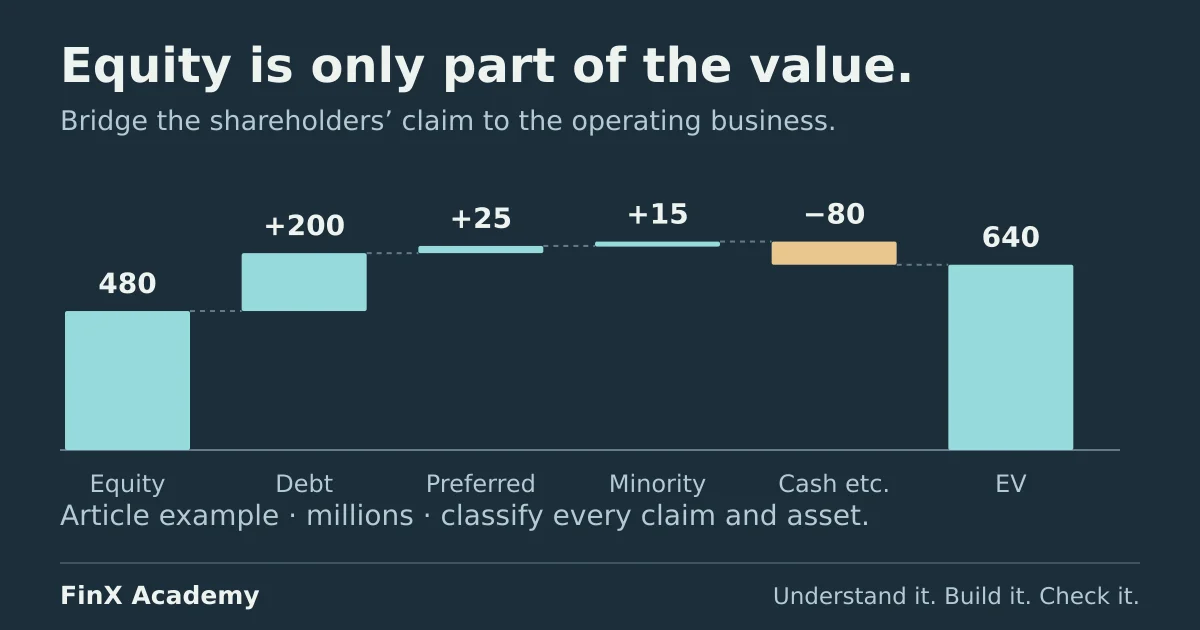
Answer: enterprise value 640, equity value 480, net debt 120, implied share price 24.00. Walk through the
bridge forward: 480 + 200 + 25 + 15 − 80 = 640. Then back: 640 − 200 − 25 − 15 + 80 = 480, which divided by
20.0 million shares returns the market’s 24.00. The reverse path tests arithmetic consistency with the same
inputs. It does not independently validate their classification: adding an inappropriate claim on the way
to EV and subtracting it on the way back can still return 480. Check each row against the stated assumptions
as well as checking the round trip.
Notice the sign flip between directions. Debt and preferred shares are added going equity → EV and subtracted going EV → equity; cash is subtracted going in and added coming back. Holding one fixed list of signs is how these bridges break. Hold the logic instead: the claims that own the business ahead of shareholders come out of the residual.
Cross-check with a multiple
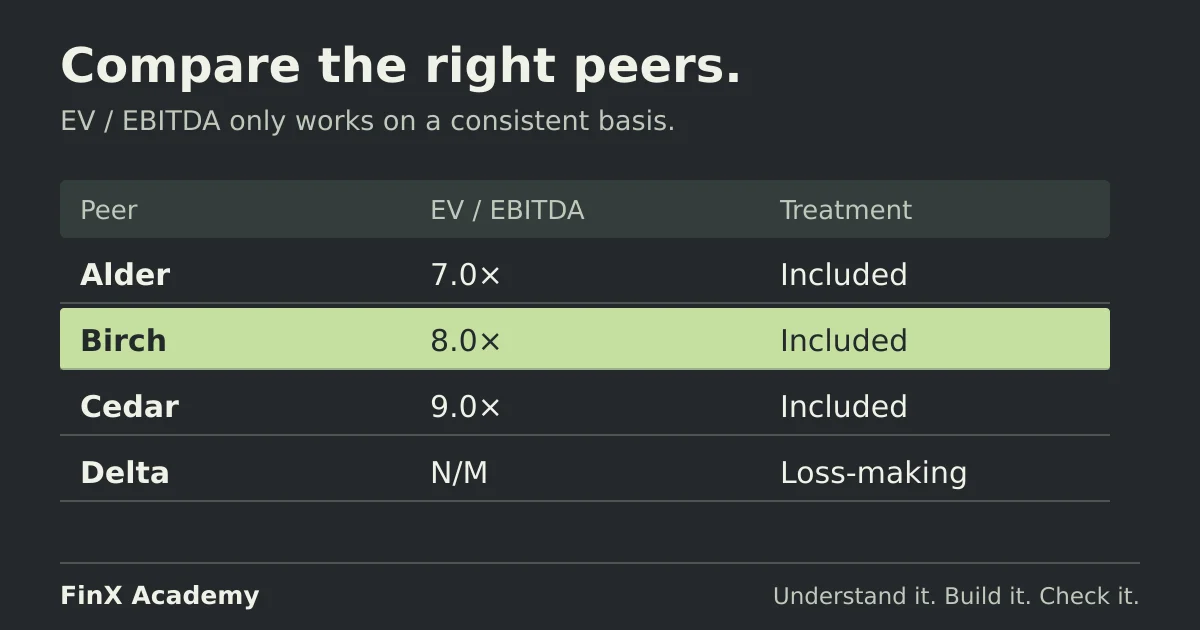
Northgate’s LTM EBITDA of 80 against EV of 640 gives 640/80 = 8.0×. Suppose a peer set — built the way
the comps guide describes — returns a median of 8.0×. Applying it back:
8.0 × 80 = 640 enterprise value, bridge out the claims, and the implied equity value is 480, or 24.00 per
share: the market already prices Northgate in line with its peers on this sample and date. A “cheap” or
“expensive” conclusion needs a reason the target deserves a different multiple — growth, margins, risk or
investment needs — not a different arithmetic.
Three ways the bridge goes wrong
Each failure below changes one decision, not the underlying company data. Hold the independently derived peer valuation at EV 640 when bridging to equity, and hold the observed market equity at 480 when building EV. Comparing those fixed anchors with a misclassified bridge exposes errors that an algebraic round trip alone can miss.
1. Stop at enterprise value. You apply the peer multiple, arrive at EV of 640, compare it directly with
market capitalisation of 480 and claim 33.3% upside, using 640/480-1. That compares different claims.
The 160 gap is debt, preferred and minority claims minus cash. Finish the bridge: the correct comparison
is common equity value 480 against 480, or 24.00 per share against 24.00. This example implies no upside
on the assumed peer multiple.
2. Subtract cash in the wrong direction. Bridge with =B18-B16-B6-B7-B17 and equity value becomes
640 − 200 − 25 − 15 − 80 = 320, or 16.00 per share. The error’s signature: the difference from the
correct 480 is 160, exactly twice the 80 of cash — subtracted where it should have been added. Any bridge
whose cash adjustment moves equity value in the same direction as a debt adjustment has a sign error.
3. Treat operating liabilities as debt. Add accounts payable and deferred revenue to the claims: equity
value becomes 480 − 75 = 405, or 20.25 per share, understated by 3.75. Payables and deferred revenue
are operating working-capital obligations already reflected in the EBITDA
and cash flows being capitalised; counting them again as financing claims makes you pay for the same
liability twice under the stated convention. The same rows inflate a from-market EV to 715 (640 + 45 + 30) and the computed multiple to 8.94× (715/80 = 8.9375) — which then
feeds an overstated peer median for everyone who reads the workbook afterwards.
Check your answers
- Equity value: 480; enterprise value: 640; net debt: 120.
- Classification: add 200 debt + 25 preferred + 15 minority; subtract 80 cash and excess investments; exclude the 45 payables and 30 deferred revenue; leases, restricted cash, convertibles and pension deficits need a stated convention, not a default.
- EV/EBITDA: 8.0×; at a peer median of 8.0× the implied share price is 24.00 — in line, not the incorrectly inferred 33.3% upside.
- Cash sign error: equity value 320, difference 160 = 2 × cash.
- Operating-liability error: equity value 405, understated by 3.75 per share; from-market EV 715, multiple 8.94×. A shared classification error in both bridge directions can still pass the round trip.
Take the next step
The same bridge appears in two full builds: the comparable-company analysis guide applies a multiple range and bridges to a per-share range, and the DCF model example bridges discounted cash flows from enterprise to equity value. FinX’s Comps & Precedents course includes a free Choosing the peer set lesson; later lessons require paid access — browse the catalogue for current access details. For a different kind of check, the free ten-minute diagnostic asks five numeric modelling questions; it is not a valuation assessment and does not grade this bridge.
Continue with guided practice
Practise choosing peers, building an enterprise value bridge and interpreting valuation multiples. Explore the Comps & Precedents syllabus and its free lesson.
Comps & Precedents course