A levered beta is business risk dressed in its owner's capital structure. Unlever every peer before comparing, state the debt and cash basis once, and relever the median unlevered beta — never the median levered one.
An unlevered beta (or asset beta) measures how risky a business’s operating cash flows are, with the effect of borrowing removed under a stated debt and cash convention. It is not total operating volatility. You need it because the beta a data service reports is a levered beta: it bundles business risk with whatever financial risk that company’s shareholders happen to carry. To price a different company’s equity, you strip each peer’s leverage out, take a typical value of the stripped betas, and add back only the leverage of the company you are valuing.
This page works a small fictional peer set — Alder, Birch, Cedar and Delta, the maintenance contractors from the comparable company analysis guide — and relevers the result onto Northgate Logistics, the company whose capital structure feeds the WACC page. Every market-value input comes from those two published tables; the regression betas are invented. Reusing the figures demonstrates the arithmetic: maintenance contractors are not established economic peers for a logistics business. Amounts are in millions of one currency, valued at 31 August 2026.
The formula, and what it assumes
Unlever:  β_U = β_L ÷ (1 + (1 − t) × D/E)
Relever:  β_L′ = β_U × (1 + (1 − t) × D_target/E_target)
The relation comes from Robert Hamada’s 1972 Journal of Finance paper: every point of business risk that the asset earns, the equity of a levered firm absorbs on the lenders’ behalf as well as its own, magnified by the after-tax weight of debt. Read the assumptions before trusting the output:
- Debt beta is about zero. The formula loads all business risk onto equity. Fine for solid investment-grade borrowing; questionable when peers carry near-distressed debt whose own returns move with the market.
- Tax shields follow a simplified financing model. The Hamada relation assumes a particular treatment of debt and its tax shield. It is an approximation, not a general identity for every debt-rebalancing policy.
tis the marginal rate on deductible interest. Here it is a stated 25% for every company; real builds must justify each peer’s marginal rate and the ability to use the deduction. An effective accounting tax rate is not automatically the appropriate marginal rate.
State the basis once: net or gross debt
The common gross-debt approach unlevers with total interest-bearing debt and treats cash separately. This exercise instead uses a net-debt convention throughout: debt minus excess cash, divided by market equity. It assumes cash and debt have similar low systematic risk. This is a material simplifying assumption; netting cash against risky debt can mislead.
Damodaran’s debt guidance requires the chosen convention to carry through beta, WACC weights and the equity bridge. Net-debt unlevering is not interchangeable with unlevering on gross debt and then separately correcting an asset beta for cash. The gross-debt WACC in our WACC guide therefore cannot simply inherit this example’s beta. The presence of net debt in an EV bridge alone does not decide which beta method to use.
The betas are fictional outputs of a five-year monthly regression against a market index, as any data service would supply:
| Peer | β_L | Debt | Excess cash | Equity (row from comps table) |
|---|---|---|---|---|
| Alder | 1.350 | 70 | 30 | 240 |
| Birch | 0.975 | 80 | 40 | 360 |
| Cedar | 1.166 | 110 | 70 | 500 |
| Delta | 1.250 | 60 | 10 | 150 |
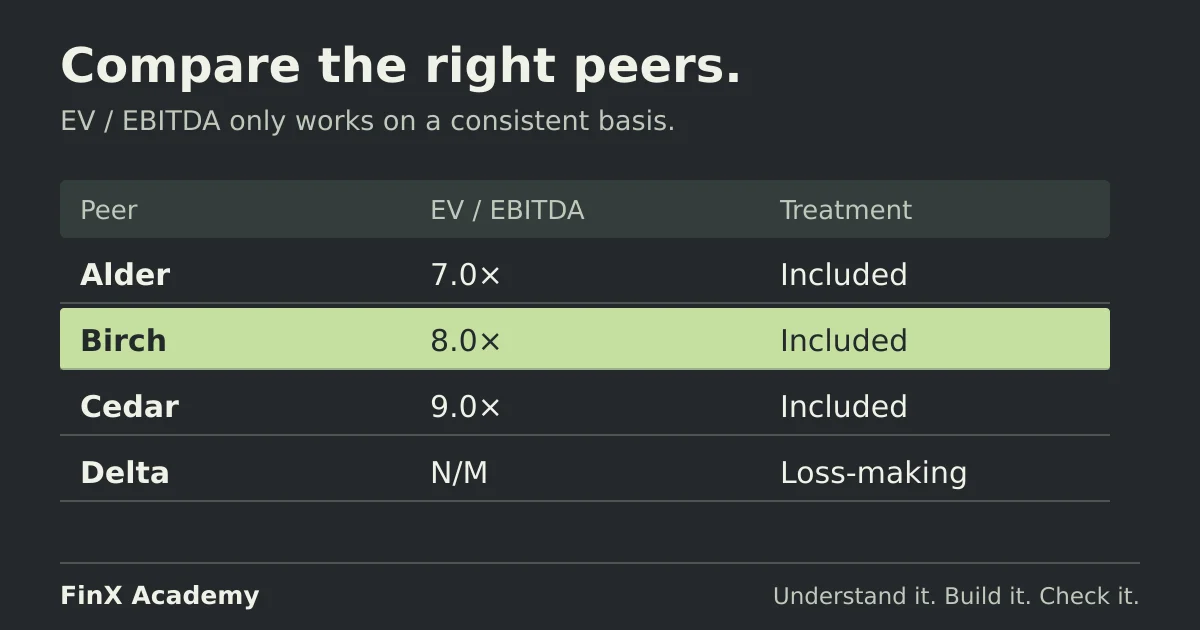
Delta is worth a note. On the comps page its EV/EBITDA multiple is N/M because EBITDA is negative; its beta stays in the sample, because regressing a stock’s returns on the market’s returns divides no number by any earnings figure. Loss-making companies can still have perfectly informative betas. Screening on risk and screening on multiples are different jobs.
Unlever each peer first
Labels in column A, peers in columns C–F, tax rate 25% in B1. Enter these formulas in column C and copy across:
| Cell | Row | Formula | Alder | Birch | Cedar | Delta |
|---|---|---|---|---|---|---|
| C4 | Levered beta (input) | — | 1.350 | 0.975 | 1.166 | 1.250 |
| C5 | Net debt | =C7-C8 |
40 | 40 | 40 | 50 |
| C6 | Net debt ÷ equity | =C5/C9 |
16.67% | 11.11% | 8.00% | 33.33% |
| C10 | Leverage factor | =1+(1-$B$1)*C6 |
1.125 | 1.083 | 1.060 | 1.250 |
| C11 | Unlevered beta | =C4/C10 |
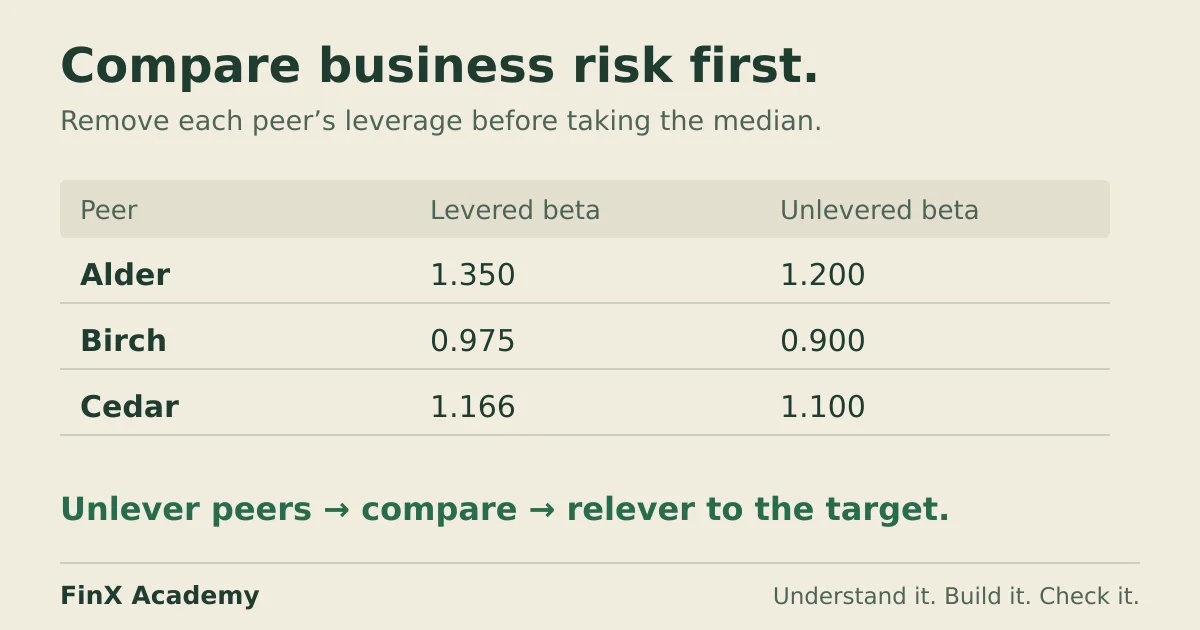
1.200 | 0.900 | 1.100 | 1.000 |
C7/C8 are debt and excess cash, C9 market equity — all four rows are the comps table quoted above.
Before reading on: predict the spread. Alder and Cedar carry moderate debt with high levered betas; Delta carries the most debt with a middling one. If the logic works, in this particular dataset the stripped betas sit closer together than the raw ones: 0.90 to 1.20, against 0.975 to 1.350 before.
Now the two samples disagree about the order of the peers. Delta looked like the second-riskiest equity; after unlevering it is only middling, because its high raw beta was substantially the financial risk of its 33% net D/E. Alder looked similar to Delta; after unlevering, Alder’s business is riskier. This is exactly why you never compare levered betas across companies with different capital structures.
Relever onto the target
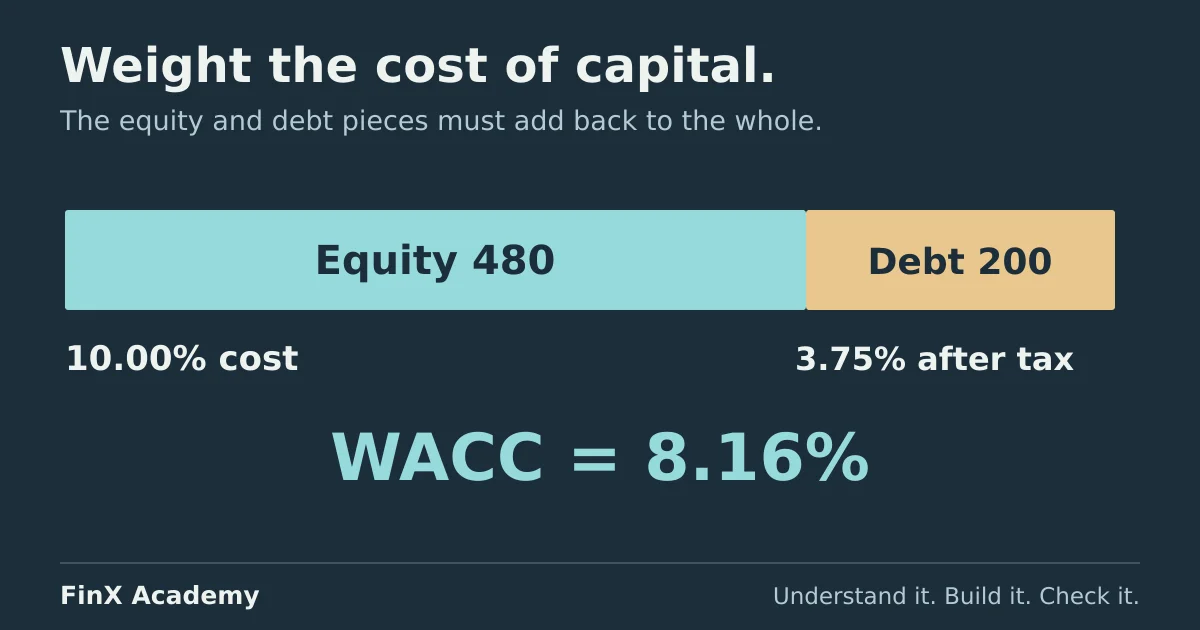
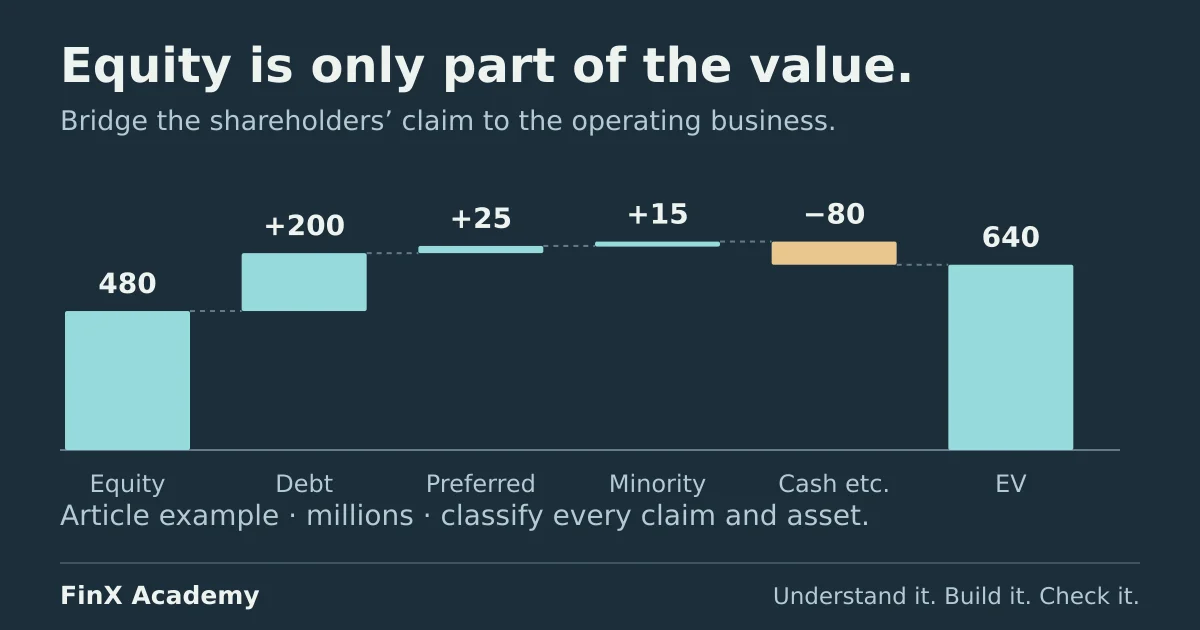
Northgate’s structure comes from the valuation bridge: market equity 480, gross debt 200, excess cash 80 — the same numbers the WACC page assembles its weights from.
| Cell | Row | Formula | Result |
|---|---|---|---|
| B14 | Median unlevered beta | =MEDIAN(C11:F11) |
1.050 |
| B15 | Target net debt ÷ equity | =(200-80)/480 |
25.00% |
| B16 | Relevered beta | =B14*(1+(1-$B$1)*B15) |
1.247 |
The four stripped betas are 0.90, 1.00, 1.10 and 1.20 — symmetric, so median and mean agree at 1.05 here; that is an artefact of a tidy teaching set, not a general rule. With four points, prefer the median and show the components: in a real sample a single distressed peer can pull a mean that no member of the group represents.
Three checks before accepting 1.247:
- Bounds. 1.05 lies inside the unlevered range 0.90–1.20, and relevering is monotonic, so 1.247 must lie inside [0.90 × 1.1875, 1.20 × 1.1875] = 1.069–1.425. ✓
- Round trip. Feed 1.247 back through the unlevering row with Northgate’s own D/E:
=B16/(1+(1-$B$1)*B15)→ 1.050. Use the unrounded B16 in that check. The chain is its own reverse check. - Direction. With positive beta, positive net debt and a tax rate below 100%, relevering must increase the same underlying beta: 1.246875 exceeds 1.05. Comparing companies with different business betas does not create a universal ranking rule.
The payoff: r_e = 4.0% + 1.246875 × 5.0% = 10.234375%. The
CAPM guide explains those illustrative 4% and 5% inputs. Keep full precision
in formulas and round only the displayed answer.
For a separate net-debt WACC illustration, use E = 480, net D = 120, a 5% debt rate and a 25% tax rate:
480/600 × 10.234375% + 120/600 × 5% × 75% = 8.9375%. At a beta of 1.2 the same net-debt convention
gives 8.75%. Neither is the published gross-debt WACC of 8.16%. This two-component illustration excludes
preferred and minority claims, just as that WACC example does.
Three ways the chain goes wrong
1. Using the levered median directly. =MEDIAN(C4:F4) gives 1.208. Copying it straight into the
target’s CAPM skips the leverage adjustment and imports the peers’ capital structures. If instead you mistake
1.208 for an unlevered beta and multiply by 1.1875, you get 1.4345: leverage has been added again.
Both differ from the stated peer-by-peer method’s 1.246875. Sector-average methods also exist, but require
a defined aggregation approach; an average levered beta alone is not an unlevered estimate.
2. Net in, gross out. Unlever the peers on net debt, then relever on Northgate’s gross 200: the factor jumps
from 1.1875 to 1.3125 and the beta to 1.378, a gap of exactly 0.13125 = β_U × (1 − t) × cash/E =
1.05 × 0.75 × 80/480. That gap is the signature of the target’s 80 of cash being netted out for every peer and
then quietly left inside the target’s leverage. r_e reads 10.89%. This mixed calculation is not a valid conversion to a
gross-debt valuation. Rebuild the full peer and target chain when changing convention.
3. Dropping the shield on the way back out. Relever as =B14*(1+B15) → 1.3125, too high by exactly
0.0656 = β_U × t × D/E. The asymmetry is the lesson: omitting (1 − t) in both directions does not generally cancel when peer and target D/E differ;
omitting it in just one direction is also inconsistent — the same one-way-slip character as the pre-tax debt
cost error on the WACC page.
What the estimate still cannot do
A median of four betas carries real error: swap the sample for one company and 1.05 moves; the regression window and index change every input. Treat the relevered beta as a range with a stated centre — which is what the bounds test above defends — rather than a number. If your build leans on one name’s beta because it is the only one that “looks right,” you have done leverage arithmetic, not analysis.
Check your answers
- Unlevered betas: Alder 1.200, Birch 0.900, Cedar 1.100, Delta 1.000 (factors 1.125, 1.083, 1.060, 1.250).
- Median 1.05; Northgate net D/E 25%; relevered beta 1.247; round trip returns 1.05; bounds 1.069–1.425 hold.
- Paired with rf 4.0% / ERP 5.0%: r_e 10.234375%; separate net-debt WACC 8.9375%.
- Error cases: levered median used directly 1.208, or levered twice 1.4345; gross-debt relever 1.378; missing
(1 − t)1.3125.
Take the next step
The peer table is built and audited in the comparable company analysis guide; the claim classification behind Northgate’s 120 net debt lives in the valuation bridge; the assembled rate this beta feeds is on the WACC page. FinX’s Comps & Precedents course includes a free Choosing the peer set lesson; later lessons require paid access — browse the catalogue for current lessons and access details. The free ten-minute diagnostic asks five numeric modelling questions; it does not grade a beta.
Continue with guided practice
Put the valuation concepts into practice with exercises on financial statements, forecasts and DCF valuation. View the syllabus and try a free lesson.
Financial Modeling & Valuation course