ROIC is comparable across years or companies only when the numerator's tax treatment, the denominator's capital base and the date convention are stated once and reused everywhere. Reconcile both sides before trusting the ratio.
ROIC = NOPAT ÷ Invested capitalReturn on invested capital (ROIC) is the after-tax profit the operating business earned on the book capital actually funding it. NOPAT — net operating profit after tax — is operating profit taxed as if the company had no debt; invested capital is the operating assets financed by providers, or equivalently the providers’ claims net of excess cash. The line above is the whole formula. Every dispute, and every wrong number, comes from three choices: what gets taxed in the numerator, which balances sit in the denominator, and at what date those balances are read.
This page builds a simplified Northgate Logistics variant using operating inputs from the cash-flow bridge, the depreciation schedule and the valuation bridge, so most inputs are figures those published pages already derived: Year 1 EBIT 56.0, a 25% cash-tax rate, interest of 10.0, net PP&E opening 140.0 and closing 136.0, debt carried at par of 200.0 and excess cash 80.0. Working-capital levels, book equity and the Year 2 forecast are new stated inputs. This variant has only debt and common equity, no preferred shares, non-controlling interests, goodwill, leases or other operating assets and liabilities beyond the balances shown. It is not a reconstruction of the valuation article’s broader capital structure. Everything is invented; amounts are in millions of one currency.
The numerator: NOPAT, built two ways
Route 1 — operating profit, taxed directly. From the cash-flow bridge: EBITDA 80.0 minus depreciation 24.0
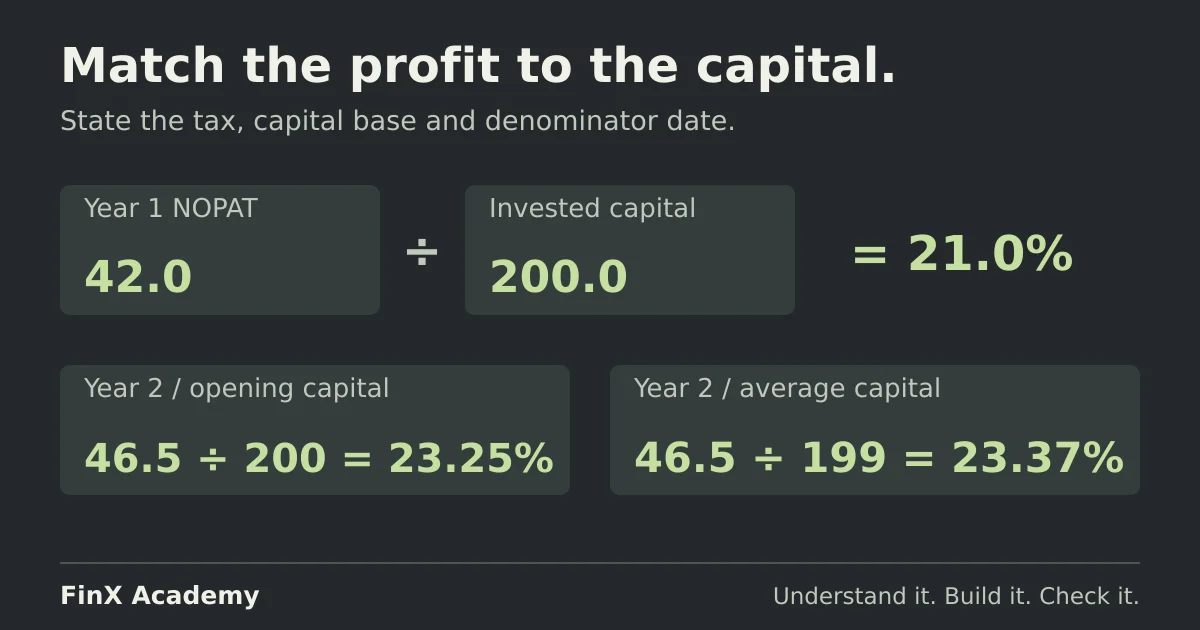
gives EBIT 56.0; then =56*(1-25%) = 42.0.
Route 2 — net income, put the lenders’ share back. Northgate’s interest is 10.0, deductible at 25%:
net income is (56.0 − 10.0) × 0.75 = 34.5, and adding back after-tax interest of 10.0 × 0.75 = 7.5 returns
34.5 + 7.5 = 42.0.
The routes agree under this case’s assumptions: no non-operating income, no capitalised interest, fully deductible interest and a single tax rate. In practice, reconcile those adjustments and the tax basis. Book tax expense and cash taxes can differ; using the same assumed tax rate in both routes can make them agree without verifying either against cash paid. The rule both routes implement is Damodaran’s: the numerator is operating income, not net income, tax-adjusted (his measurement paper lists exactly these definitional choices and why each one is there).
The denominator: invested capital, reconciled from both sides
Build it twice, from the assets and from the claims:
| Route | Components | Result |
|---|---|---|
| Uses — operating assets | closing net PP&E 136.0 + operating working capital 64.0 | 200.0 |
| Sources — providers’ capital | gross debt 200.0 − excess cash 80.0 + book equity 80.0 | 200.0 |
The 64.0 of working capital is a stated opening balance of 60.0 plus the same 4.0 build the cash-flow bridge
subtracted; the 80.0 of book equity is a stated input (the published pages carry the market value 480.0, not the
book value). A reconciliation cell, uses − sources, returns 0.0 — that agreement is the check.
What it catches is any one-sided classification error: payables dropped from working capital, excess cash left in the sources, net PP&E carried at opening instead of closing. What it cannot catch is a wrong convention that touches both sides at once — the same limitation the valuation bridge’s round trip has. State the classification alongside the number.
For a consolidated company, match the capital base to the operations included in NOPAT. If NOPAT includes 100% of a controlled subsidiary’s operating profit, include the corresponding capital, including non-controlling interests. Preferred capital is also a financing claim; adding it does not by itself add subsidiary assets. Never drop either claim merely to simplify the denominator.
Here the simplified balance sheet reconciles: operating capital 200.0 plus excess cash 80.0 equals debt 200.0 plus common book equity 80.0. Excess cash is netted out because NOPAT excludes its investment income. Required operating cash, if present, would need a separately stated treatment.
Book value, not market, is the standard denominator. Market equity embeds expectations of future growth and risk. Dividing current NOPAT by market-valued operating capital produces an earnings yield on price, not a historical return on invested book capital. That yield need not equal WACC, even when the market price is fair.
The ratio, and the comparison that makes it mean something
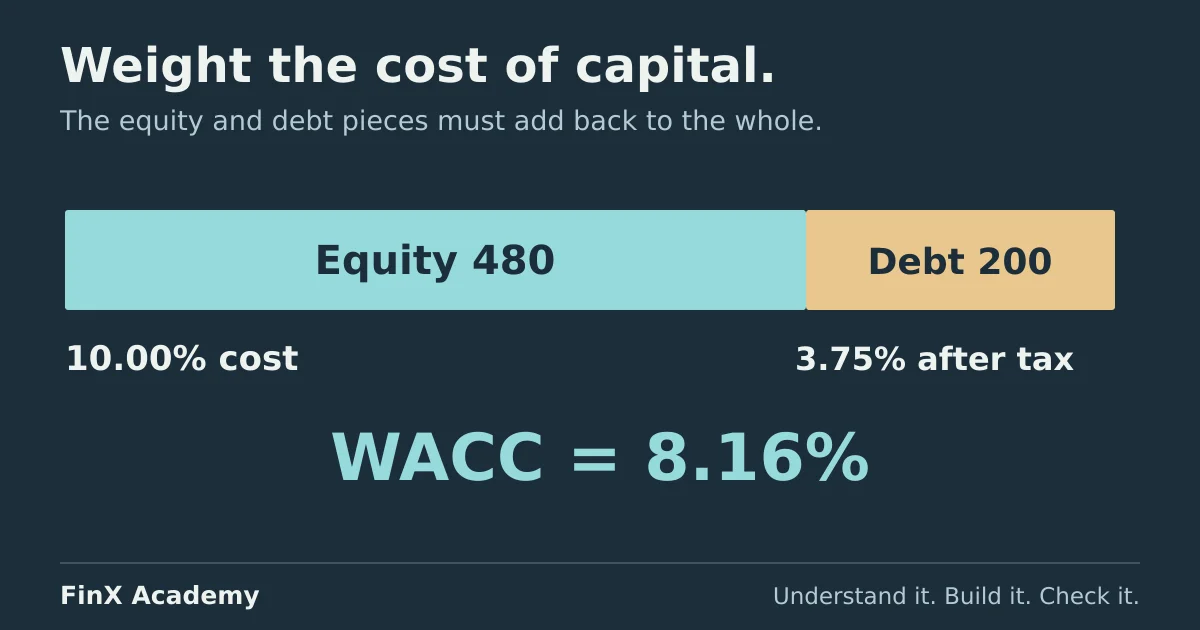
42.0 ÷ 200.0 = 21.0%. For an illustrative comparison, assume an 8.16% operating WACC is appropriate for this variant, using the rate assembled in the WACC guide as a supplied benchmark. The spread is 12.84 percentage points, and 42.0 − 8.1618% × 200.0 = 42.0 − 16.3 =
25.7 of economic profit for the year. This conclusion is conditional on the benchmark. In a real comparison, align operating scope, currency, risk, period and tax basis; adjust cash and financing claims consistently when estimating WACC. An accounting ROIC spread is an indicator, not proof of a market mispricing.
Before anyone celebrates, one reconciliation: Northgate’s net reinvestment in Year 1 was
capex 20.0 − depreciation 24.0 + working-capital build 4.0 = 0.0, which is exactly why the published bridge’s
unlevered free cash flow of 42.0 equals NOPAT. A 21% return on frozen capital says nothing yet about the return
on the next 100.0 invested — growth is funded by reinvestment, and the returns it earns are the whole game that
the DCF guide’s growth assumptions play.
Opening, closing, average: choosing the denominator date
Year 1 has a flat capital base: net PP&E fell by 4.0 while working capital rose by 4.0, so invested capital is 200.0 opening, closing and average — every convention answers 21.0%. You cannot learn date sensitivity from a year in which the base happens to be flat.
Year 2 moves. Stated forecast: revenue 440.0, EBITDA 90.0; working capital builds a further 6.0; depreciation
28.0 and closing net PP&E 128.0 come from the published schedule. NOPAT is (90.0 − 28.0) × 0.75 = 46.5 —
profit up 10.7% — while invested capital falls from 200.0 to 128.0 + 70.0 = 198.0. Predict before reading:
with a shrinking denominator, which date flatters the ratio most?
| Convention | Calculation | ROIC |
|---|---|---|
Opening (Year 1 close) |
46.5 / 200.0 |
23.25% |
| Closing | 46.5 / 198.0 |
23.48% |
| Average of the two | 46.5 / 199.0 |
23.37% |
Opening is Damodaran’s convention in the paper above — the capital is fixed before the year’s profit can inflate or defend the base; screens often average; closing is the one that flatters when balances are falling. The spread here is only 0.23 points because the base barely moved; a large acquisition or capex year can make it much wider. A time-weighted capital base may then be more representative than a simple opening/closing average. The convention itself matters less than picking one, stating it on the sheet, and using it in every column of a time series — 23.25/23.48 mixed across years is not a comparison, it is two different formulas.
And note the trap underneath all three numbers: EBITDA margin moved 20.00% → 20.45%, yet ROIC “improved” by more
than two points. The depreciation schedule already told us why: the charge (28.0) exceeds capex (20.0), so the
fleet’s accounting carrying value is falling and the denominator shrinks almost by definition. Hold NOPAT at
42.0 and use only the closing base — 42.0/198.0 = 21.21% — and the aging balance sheet alone is worth +0.21
points. Check capex against depreciation before crediting the entire ROIC increase to operating performance. Accounting depreciation alone does not establish the fleet’s physical condition or required replacement spending.
Three ways the ratio becomes inconsistent
1. Tax left in the numerator. 56.0/200.0 = 28.0% — overstated by exactly 7.0 points, the unlevered operating tax of
14.0 divided by the 200.0 of capital. Pre-tax return on capital is a real measure; comparing it to an after-tax
WACC is comparing a gross profit stream to a net required return. The signature of this error is that the gap
equals the tax line over capital.
2. Working capital missing from the denominator. 42.0/136.0 (net PP&E only) = 30.88%, 9.88 percentage points above
the stated 21.0%. Somebody financed those 64.0 of receivables and inventory too — a third of the capital here —
and a ratio that only moves when the PP&E balance moves is measuring the asset mix, not the business. Compare
“asset-light” stories across different working-capital intensities with this failure in mind.
3. Market values in the denominator. Assume common market equity of 480.0 for this simplified variant. Net debt 120.0 plus that equity gives market-valued operating capital of 600.0, and 42.0/600.0 = 7.0%, which sits below
the WACC of 8.16% and would falsely flip the verdict to value destruction if treated as book-capital ROIC.
The 7.0% is current NOPAT divided by a market price. Growth expectations can explain why such a yield is below WACC; it does not establish value destruction. Use book capital for the stated ROIC calculation.
Check your answers
- Year 1: NOPAT 42.0 both routes (34.5 + 7.5); invested capital 200.0 both routes (136.0 + 64.0; 200.0 − 80.0 + 80.0); ROIC 21.0% on every date convention.
- Versus WACC 8.16%: excess return 12.84 points; economic profit ≈ 25.7; net reinvestment 0.0, which is why UFCF = NOPAT = 42.0 in the published bridge.
- Year 2: NOPAT 46.5; capital 200.0 / 198.0 / 199.0 → 23.25% / 23.48% / 23.37%; the aging base alone contributes +0.21 points.
- Errors: EBIT numerator 28.0% (gap = 14.0/200.0 = 7.0 points); PP&E-only denominator 30.88%; market denominator 7.0%, an earnings yield that cannot replace book-capital ROIC.
Take the next step
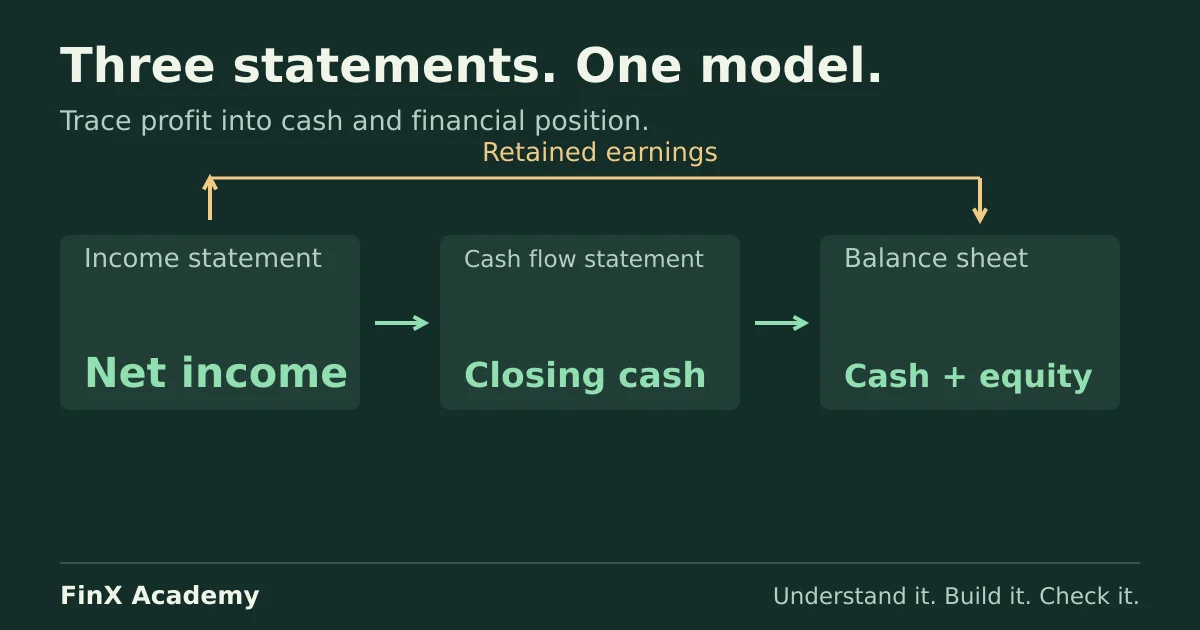
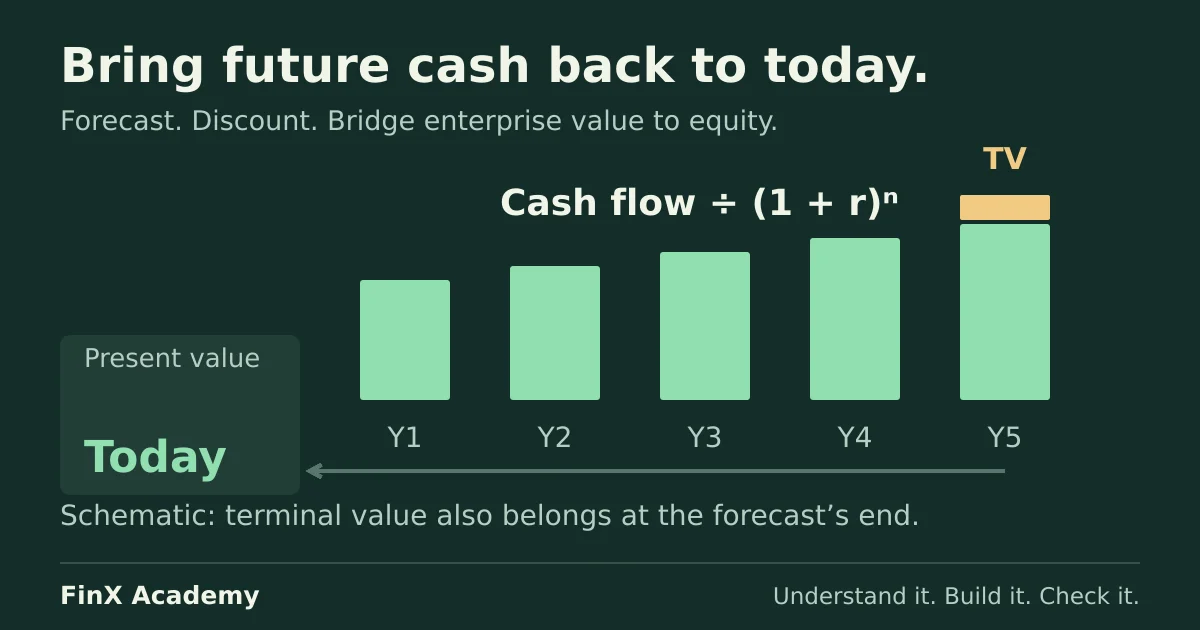
The three-statement model guide builds the connected statements that supply both sides of this ratio; the WACC guide assembles and audits the rate 21.0% was compared against; and the DCF build shows what the market pays when a business like Northgate is expected to keep earning those excess returns. FinX’s Three-Statement Build course covers the model this ratio is read from — browse the catalogue for the current syllabus and access requirements. The free ten-minute diagnostic asks five numeric modelling questions; it does not grade a return measure.
Continue with guided practice
Connect the schedules in one integrated income statement, balance sheet and cash flow model. Explore The 3-Statement Build syllabus and start with a free lesson.
The 3-Statement Build course