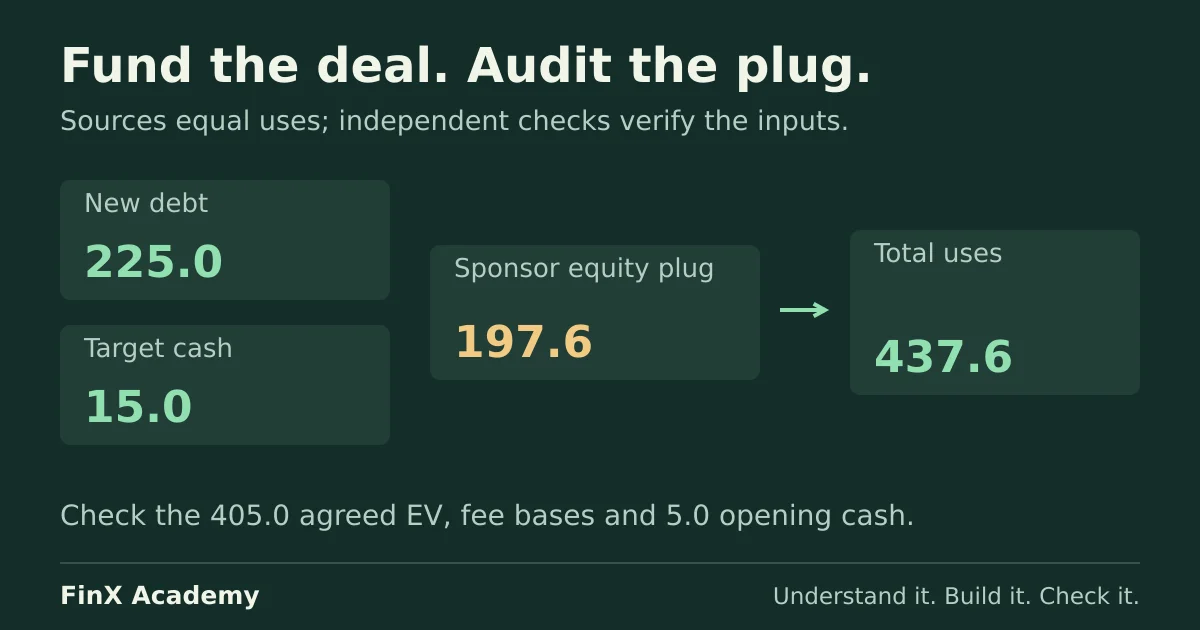
With sponsor equity as the plug, Sources minus Uses is zero by construction; it checks the wiring but cannot validate the deal inputs. Re-bridge the purchase price to the agreed enterprise value, tie the equity line back to the per-share offer, and check fee bases and opening cash explicitly.
A sources and uses table lists what an acquisition costs (the uses) and where the money to pay for it comes from (the sources). It is the closing-day funds flow of a deal: enter the offer price and the financing terms, and the table returns the sponsor’s equity check.
In this example, the sponsor equity contribution is calculated as the remaining funding need. Sources equal uses because that equity formula fills the gap. Other deals can fix equity commitments and solve for debt or a funding shortfall instead. The balance check is therefore zero by construction — a table with a serious error in it still “checks”. This page builds the table for a fictional buyout and then installs the checks that actually catch things.
The deal
The target is the same regional industrial-maintenance business the comps and precedent transactions guides value: LTM EBITDA 45.0 (period ending 30 June 2026), existing debt 90.0, available cash 15.0, 20.0 million shares. A sponsor has agreed to buy it at 16.50 per share — in this fictional deal, exactly the precedent-median value that article derived. Amounts are in millions of one currency; every financing term below is a new fictional assumption.
The financing terms, stated once:
- The existing debt is fully refinanced at closing; the new capital structure is all new money.
- New debt is sized in turns of LTM EBITDA: 4.0× senior term loan, 1.0× junior notes.
- Advisory and other transaction fees: 2.0% of transaction enterprise value. Financing fees: 2.0% of new debt raised.
- The lenders require 5.0 of cash on the opening balance sheet.
- The target’s entire available cash balance of 15.0 is applied at closing; 5.0 is then funded back into the acquired business. No separate operating cash balance is carried over. This explicit drain-and-refill assumption keeps the opening-cash treatment unambiguous.
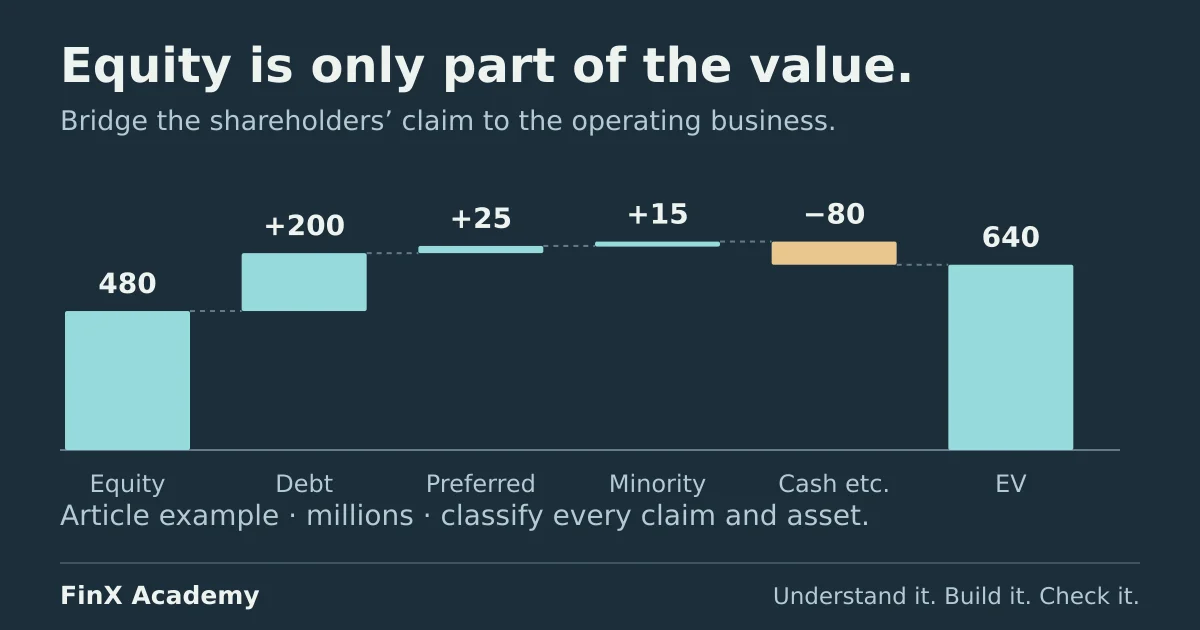
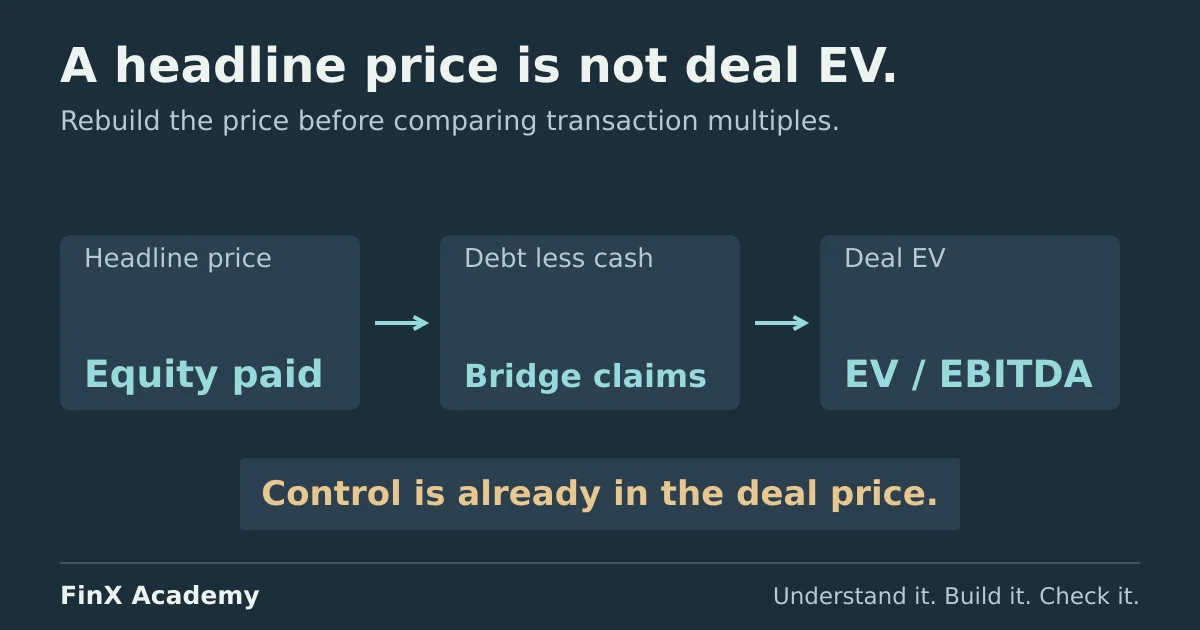
The offer price is 100% of equity: 16.50 × 20.0 million shares = 330.0 to the shareholders. Everything that must additionally be paid for, or that helps pay, is a separate line. The per-share offer already nets debt and cash out of the enterprise value — the two definitions are exactly what the valuation bridge separates; this page applies it at closing.
Enter the deal inputs
Put labels in column A and inputs in column B of a blank sheet:
| Cell | Item | Input |
|---|---|---|
| B2 | Target LTM EBITDA | 45.0 |
| B3 | Shares outstanding (millions) | 20.0 |
| B4 | Existing debt (refinanced at closing) | 90.0 |
| B5 | Target cash available | 15.0 |
| B6 | Senior debt — turns of LTM EBITDA | 4.0 |
| B7 | Junior notes — turns of LTM EBITDA | 1.0 |
| B8 | Advisory and transaction fees — % of transaction EV | 2.0% |
| B9 | Financing fees — % of new debt | 2.0% |
| B10 | Minimum opening cash | 5.0 |
| B11 | Offer per share | 16.50 |
| B12 | Agreed transaction EV (independent deal input) | 405.0 |
Note that two inputs are percentages, not amounts. Typing 8.1 for a fee instead of a formula is how the
breaks in the section further down become invisible.
Uses: what the deal costs
Enter the labels in column C of rows 5–10, preserving the input labels in column A, and these formulas in column D, with the row-8 and row-9 fee formulas linking forward to the debt and EV rows built below:
| Row | Use | Amount | Formula in D |
|---|---|---|---|
| 5 | Purchase of target shares | 330.0 | =B11*B3 |
| 6 | Refinance existing debt | 90.0 | =B4 |
| 7 | Fund minimum opening cash | 5.0 | =B10 |
| 8 | Advisory and transaction fees | 8.1 | =B8*D17 |
| 9 | Financing fees on new debt | 4.5 | =B9*(D12+D13) |
| 10 | Total uses | 437.6 | =SUM(D5:D9) |
Read the first three lines as three different payees. Row 5 buys the shares from the shareholders. Row 6 pays off the target’s lenders, because this deal refinances rather than assumes. Row 7 leaves cash in the acquired business to operate with. The fee rows then charge the deal itself: 2% × transaction EV 405.0 = 8.1, and 2% × new debt 225.0 = 4.5.
Before calculating anything, predict the total: 330 + 90 + 5 is 425 of hard cost, and the fees add about 13 on top. If a completed table shows something far from 437.6, a formula row has been overwritten.
Sources: where the money comes from
Rows 12–16, same column D:
| Row | Source | Amount | Formula in D |
|---|---|---|---|
| 12 | New senior term loan | 180.0 | =B6*B2 |
| 13 | New junior notes | 45.0 | =B7*B2 |
| 14 | Target cash applied | 15.0 | =B5 |
| 15 | Sponsor equity | 197.6 | =D10-SUM(D12:D14) |
| 16 | Total sources | 437.6 | =SUM(D12:D15) |
The debt rows multiply EBITDA turns by B2, so they reprice automatically if the earnings figure is
restated. Row 14 is the target’s own cash: applying it here reduces the sponsor funding need by 15.0. The 330.0 paid to selling shareholders stays the agreed offer amount.
This is the residual-equity convention also used in A Simple Model’s sources and uses walkthrough. Row 15 is the plug. Total uses of 437.6 minus the 180.0 + 45.0 + 15.0 raised elsewhere leaves 197.6 for the sponsor. The funding mix: new debt 51.4%, sponsor equity 45.2%, target cash 3.4%. Closing leverage on the 225.0 of new debt is 5.0× gross and, after the 5.0 funded minimum cash, 4.9× net of EBITDA — the number the debt schedule you build next will carry forward.
And now the trap: row 16 minus row 10 is 0.0, and it would be 0.0 whatever row 5 said, because row 15 absorbs every error upstream of it.
The checks that actually work
Add this audit block in columns C:D. Rows 17–19 are internal calculations; rows 20–24 test them against separately stated inputs:
| Row | Check | Result | Formula in D |
|---|---|---|---|
| 17 | Transaction EV (=D5+D6-D14) |
405.0 | helper for row 8 |
| 18 | Sources − uses | 0.0 | =D16-D10 |
| 19 | Implied EV/LTM EBITDA | 9.0× | =D17/B2 |
| 20 | EV vs agreed value | 0.0 | =D17-B12 |
| 21 | Per-share price vs offer | 0.0 | =D5/B3-B11 |
| 22 | Advisory vs agreed fee base | 0.0 | =D8-B8*B12 |
| 23 | Financing fee vs stated debt sizing | 0.0 | =D9-B9*(B6+B7)*B2 |
| 24 | Opening cash vs requirement | 0.0 | =B5-D14+D7-B10 |
- Re-bridge to the agreed price. The purchase of shares plus refinanced debt less cash applied must rebuild the transaction enterprise value: 330.0 + 90.0 − 15.0 = 405.0, and 405.0 ÷ 45.0 = 9.0× — the multiple the deal was agreed at. Any purchase-basis error moves this number, and the plug cannot hide it, because D20 compares the reconstructed EV against the independently entered deal value in B12.
- Tie row 5 back to the offer. Row 5 ÷
B3must return the offer per share exactly: 330.0 ÷ 20.0 = 16.50. D21 catches an overwritten shares line; it cannot catch an incorrect offer input that has also been copied into the underlying deal memo. - Reconcile the funding identity, then test fee bases separately. Sponsor equity plus new debt less opening cash equals transaction EV plus fees: 197.6 + (225.0 − 5.0) = 417.6, against transaction EV 405.0 plus 12.6 of total fees = 417.6. This identity uses the same inputs on both sides, so it can also pass with wrong fees. D22 and D23 test the fee amounts against the independently stated bases.
- Confirm the opening liquidity. Closing cash = 15.0 acquired − 15.0 applied + 5.0 funded = 5.0, equal to the requirement. D24 compares the reconstructed cash with the lender’s separate requirement in B10. Do not derive the requirement from the amount funded.
Break the table and trace the effect
1. Enterprise value typed into the shares line. Replace row 5 with 405.0 — the EV you found in the valuation memo — and leave the refinancing row in. Total uses become 405.0 + 90.0 + 5.0 + 9.6 + 4.5 = 514.1 (the linked advisory rises with the inflated EV helper), and the plug grows to 274.1, up 76.5: the 75.0 of net debt paid for twice, plus 1.5 of extra fee on it. Sources − uses still reads 0.0. The checks that fire: the re-bridge gives 405.0 + 90.0 − 15.0 = 480.0 → 10.7×, not 9.0×; and row 5 ÷ shares gives 20.25, not the agreed 16.50. The tell is structural, not numerical: if the table pays off the target’s debt and prices the deal as an enterprise value, someone has paid the lenders twice.
2. A fee on the wrong base. Change the advisory formula to =B8*D5 — 2% of the purchase of shares,
6.6 instead of 8.1. Total uses 436.1, plug 196.1, and the difference is exactly −1.5 = 2% ×
(90.0 − 15.0), the net debt that D5 omits from the EV. The balance, multiple and per-share checks do not move: the multiple and
per-share checks look at row 5, and the 416.1 = 416.1 identity survives because both of its sides now use
the same wrong fee. D22 flags −1.5 because it recomputes 2% × agreed EV 405.0 = 8.1. A formula can be wrong too: check its base, not merely whether the cell contains a formula.
3. Omit minimum cash. Set D7 to zero while preserving the row and the separate B10 requirement. Uses fall to 432.6 and the plug to 192.6 — exactly 5.0 less — and the balance, price and funding-identity checks still pass when the funding identity uses the same zero opening-cash amount. D24 fails at −5.0 because the requirement is preserved separately. What broke? Opening cash is now zero, below the lenders’ 5.0. The separate liquidity requirement exposes the problem: an acquisition can be perfectly funded and still fail day-one liquidity in the same file.
Assumed debt and rollover equity
Two line items that trip people up, both invisible to the plug:
- Assumed debt (debt the buyer takes over without repaying) is a non-cash item. A gross transaction presentation may show it on both sides; a cash-only funds flow excludes it from both. State the presentation and do not also treat assumed debt as a cash payoff. This example refinances instead, so the existing 90.0 appears only as a use and the 225.0 of new debt only as a source.
- Rollover equity (selling shareholders keep part of their stake) is a source that directly reduces the sponsor’s plug, when the uses include the full equity purchase price. It is non-cash consideration, not cash available to pay fees. If management rolled 30.0 of its 330.0 consideration here, the sponsor check would fall from 197.6 to 167.6, while sponsor plus rollover equity stays 197.6. Company leverage does not rise solely because the sellers retain ownership; the sponsor owns a smaller share of the equity.
Separate cash paid, cash raised and non-cash consideration. Reconcile that presentation to the purchase agreement and financing terms. If the equity plug is negative, investigate overfunding or cash distribution assumptions rather than presenting it as an ordinary equity contribution.
Check your answers
- Uses 437.6: shares 330.0, refinancing 90.0, cash 5.0, advisory 8.1, financing 4.5.
- Sources 437.6: senior 180.0, junior 45.0, target cash 15.0, sponsor equity 197.6.
- Transaction EV 405.0 = 9.0×; implied per-share 16.50; gross leverage 5.0×, net 4.9×.
- Identity: 197.6 + 220.0 = 417.6 = 405.0 + 12.6.
- Breaks: EV-as-shares-price → uses 514.1, plug 274.1 (+76.5), checks read 10.7× and 20.25; equity-based advisory → plug 196.1 (−1.5, exactly 2% of net debt); no-minimum-cash → plug 192.6, the funding identity passes, but the separate opening-cash check fails by −5.0.
- Senior at 3.0×: new debt 180.0, financing fee 3.6, uses 436.7, plug 241.7 (+44.1 = 45.0 of debt forgone less 0.9 of fee). With the other assumptions fixed here, the reduction in debt exceeds the fee saving and increases sponsor equity.
Take the next step
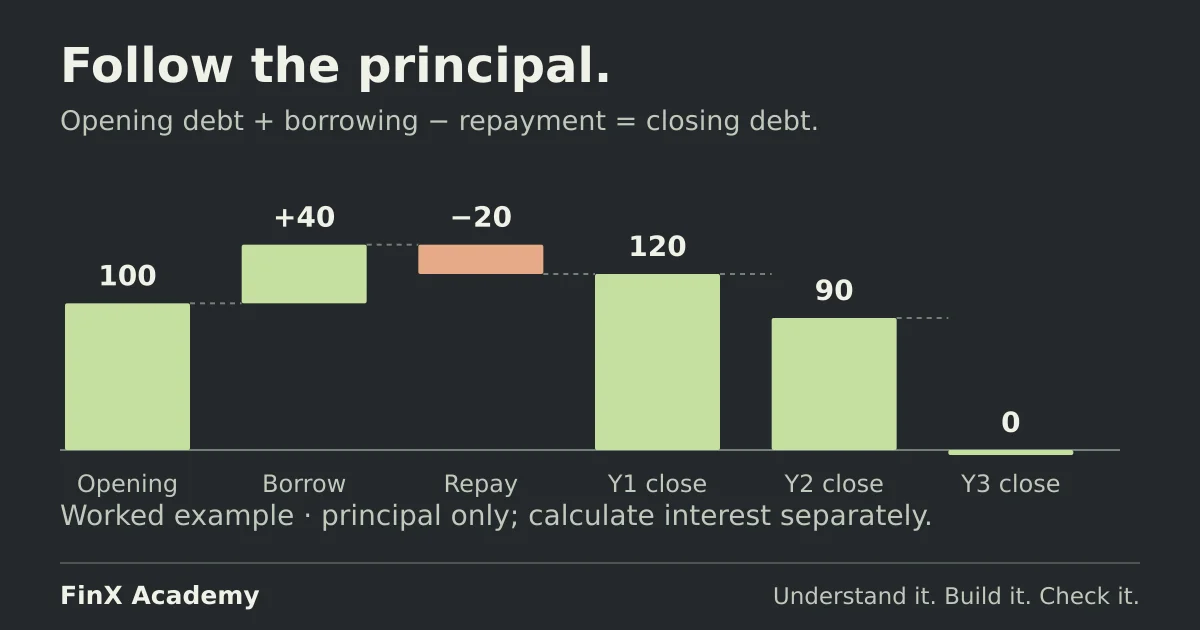
The purchase-basis decisions all come from the enterprise value vs equity value bridge, and the agreed 9.0× comes from the precedent transaction analysis. From closing day forward, the new 180.0 + 45.0 of debt runs through a debt schedule, and the full wiring appears in the three-statement model. FinX’s LBO & M&A course starts with the free Paper LBO lesson; the graded Sources and Uses lesson that follows requires paid access — browse the catalogue for current lessons. The free ten-minute diagnostic asks five numeric modelling questions; it does not grade a funds flow.
Continue with guided practice
Practise choosing peers, building an enterprise value bridge and interpreting valuation multiples. Explore the Comps & Precedents syllabus and its free lesson.
Comps & Precedents course