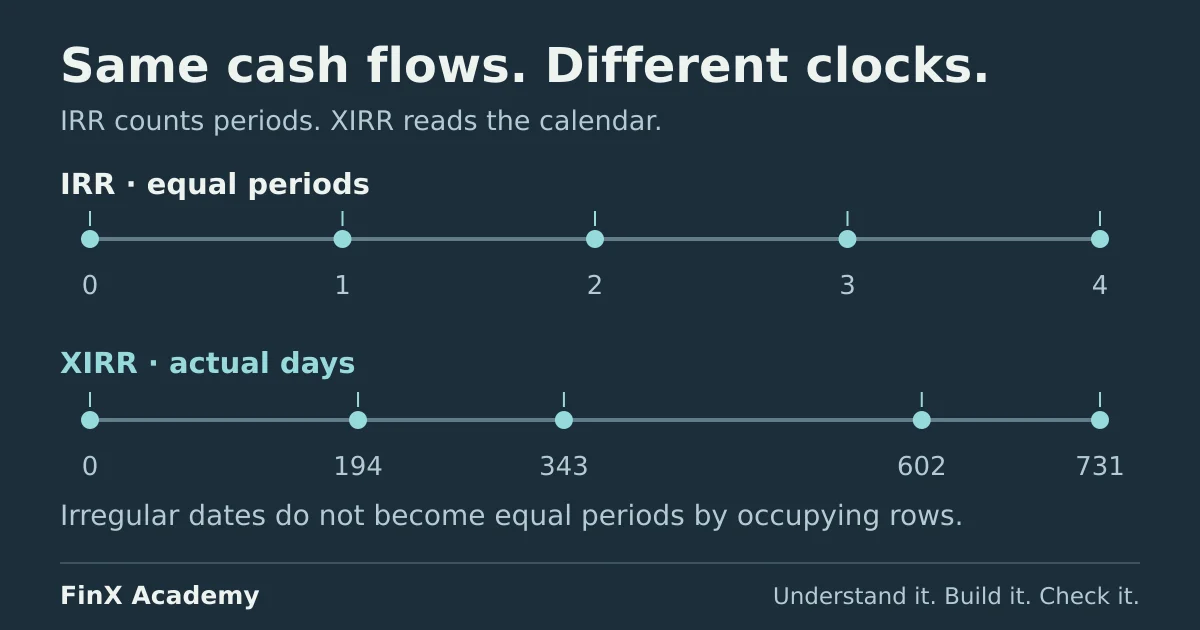
IRR returns a rate per row and assumes every row is one equal period; XIRR returns an annual rate on the actual dates, assuming a 365-day year. With irregular dates only XIRR's answer can be reconciled to the calendar — and when the signs flip more than once, no single internal rate honestly summarises the flows.
IRR versus XIRR is a question about dates, not about returns. =IRR(values) treats every row as one
equal-length period and gives you a rate per period. =XIRR(values, dates) uses the real gaps between the
dates and gives you an annual rate — Microsoft’s XIRR documentation
states the basis plainly: it is calculated “based on a 365-day year”. If your cash flows genuinely arrive on a
periodic grid, IRR is the right tool, and the NPV in Excel guide already walks through it with
the NPV-at-IRR check. If the money arrives on real-world dates — a distribution late, an exit early, a gap where
a scheduled payment never came — then IRR is silently answering a question about a schedule that never happened.
This article takes one investment with the same five amounts at the same irregular dates and shows that both
functions disagree, which answer the dates actually support, and the sign pattern where neither function has an
honest answer.
Amounts are in whole dollars, all figures fictional.
The investment record
You invest in a fictional roastery in February 2023. Distributions arrive whenever there is spare cash; you sell
your stake in February 2025. Enter the dates in A4:A8 and the flows in B4:B8 — outflow negative, inflows
positive — with headers in row 3:
| Row | A: Date | B: Cash flow | Days from first date |
|---|---|---|---|
| 4 | 6 Feb 2023 | −25,000 | 0 |
| 5 | 19 Aug 2023 | 1,200 | 194 |
| 6 | 15 Jan 2024 | 900 | 343 |
| 7 | 30 Sep 2024 | 2,000 | 602 |
| 8 | 6 Feb 2025 | 27,500 | 731 |
Look at the spacing column: 194, 149, 259 and 129 days between flows. No period, no pattern. The total gain is 26.4% on the money in over the whole life (6,600 on 25,000), but that number ignores when the cash came back — which is exactly what both functions are trying to capture. Before reading on, predict: does the periodic IRR overstate or understate the annual return here? The spacing decides; the arithmetic follows.
What IRR says
Put IRR of the five rows in A10 and =IRR(B4:B8) in B10. The result is 6.4456%.
Read that number carefully: it is the rate per row, as if rows 4–8 were consecutive equal periods of some unspecified length. Excel found the rate that discounts 1,200 one period out, 900 two periods out, 2,000 three and 27,500 four. But the last payment is 731 days out and the one before it 129 days out. The function cannot see either fact — its only input is the list of values. A row-based 6.4456% is a correct answer to the wrong question.
Annualising makes the wrong question visible. If you believed the rows were half-years you would report
(1 + 6.4456%)² − 1 = 13.31%; if you doubled the rate you would report 12.89%. Neither assumption
survives the spacing column, and the two answers already disagree with each other.
What XIRR says
Put XIRR of the same record in A11 and =XIRR(B4:B8,A4:A8) in B11. The result is 13.22%, and it is
annual by construction — no period assumption to state, because the dates were the input.
Do not trust either number yet. XIRR solves an equation, so verify its answer the way NPV in Excel verifies a periodic IRR: discount every flow at the reported rate and check that the total is zero. The exponents are the actual day counts divided by 365:
| Cell | Formula | Result |
|---|---|---|
| C4 | =B4 |
−25,000.00 |
| C5 | =B5/(1+$B$11)^((A5-$A$4)/365) |
1,123.37 |
| C6 | =B6/(1+$B$11)^((A6-$A$4)/365) |
800.89 |
| C7 | =B7/(1+$B$11)^((A7-$A$4)/365) |
1,629.68 |
| C8 | =B8/(1+$B$11)^((A8-$A$4)/365) |
21,446.06 |
| C9 | =SUM(C4:C8) |
0.00 |
Put Check: value at XIRR in A9. The discounted flows net to zero, so 13.22% is the rate at which this dated
record is worth exactly what you paid. The check confirms consistency between the function and the day-count
convention — not that the roastery forecast was accurate.
The dates move the answer; IRR does not notice
Change A8 to 6 Dec 2024 — you exit two months earlier, same 27,500. XIRR now returns 14.41%: the same
amounts earned a higher annual return because the money was at work for a shorter time. =IRR(B4:B8) is
unchanged at 6.4456%, because moving a date changes nothing in a range of values.
This is the practical difference in one edit. When timing carries information, only the function that reads the dates can carry the information into the answer. Note also that 13.22% (the correct XIRR) and 13.31% (the naive half-year annualisation of IRR) sit close together here — that is coincidence, not forgiveness: this record’s average gap happens to be near half a year, and on a different date pattern the two numbers drift arbitrarily far apart.
When no single rate exists: two sign changes
Both functions work by iteration from a starting guess (10% if you omit the argument) and return #NUM! when
they cannot converge: Microsoft’s IRR documentation
gives up after 20 tries at 0.00001 percent accuracy, the XIRR documentation after 100 tries at 0.000001 percent.
Both also require at least one positive and one negative value. The interesting failure is subtler. Take a periodic series that flips sign twice:
invest 10,000, later receive 23,000, then pay out 12,000 to settle an obligation. Check two rates by hand:
- At 50%:
−10,000 + 23,000/1.5 − 12,000/1.5² = −10,000 + 15,333.33 − 5,333.33 = 0. - At −20%:
−10,000 + 23,000/0.8 − 12,000/0.8² = −10,000 + 28,750 − 18,750 = 0.
Two different rates both make the discounted total exactly zero, so “the” internal rate of return is not a property
of these cash flows — it depends on where the iteration starts. Whichever single number a spreadsheet reports, it
hides the other. (The reinvestment assumption behind a single IRR is a separate weakness, which Excel’s
MIRR function addresses; MIRR does not fix
multiple sign changes.) The roastery record flips sign exactly once — out, then in — and with the only negative
flow first, the discounted total strictly decreases as the rate rises, so exactly one rate can zero it; 13.22% is
genuinely unique there. CFI’s XIRR vs IRR guide
makes the same recommendation from the practitioner side: when the pattern is not a single change, fall back on
the NPV at a stated discount rate — the discipline the DCF model guide builds the whole
valuation on.
Which function, when
- Flows on a true periodic grid, one per period:
IRR. The rate is per period — annualise a monthly result as=(1+IRR(range))^12-1, never by multiplying by 12. - Actual dates, uneven gaps, off-cycle interim flows, a mid-period exit:
XIRR. Enter real dates with the values; Microsoft’s XIRR reference requires the values and dates ranges to be the same length. - Any result you plan to quote: rebuild the discounting column and check it nets to zero, as above.
- More than one sign change: there is no unique internal rate; report NPV at your stated hurdle instead.
For a dated start-to-end investment — one outflow, one inflow, actual dates — the CAGR-style question is answered
on the CAGR in Excel guide, which uses the same XIRR for exactly that simplest case.
Check your answers
- IRR of the five rows: 6.4456% per row; the half-year annualisation 13.31% and the doubling 12.89% both rest on false period assumptions.
- XIRR of the record: 13.22%; the dated check column sums to 0.00 (−25,000.00; 1,123.37; 800.89; 1,629.68; 21,446.06).
- Early exit at 6 Dec 2024: XIRR 14.41%; IRR unchanged at 6.4456%.
- Sign-flip series (−10,000, +23,000, −12,000): 50% and −20% both zero the discounted total — verify both by hand; neither number alone describes the investment.
Take the next step
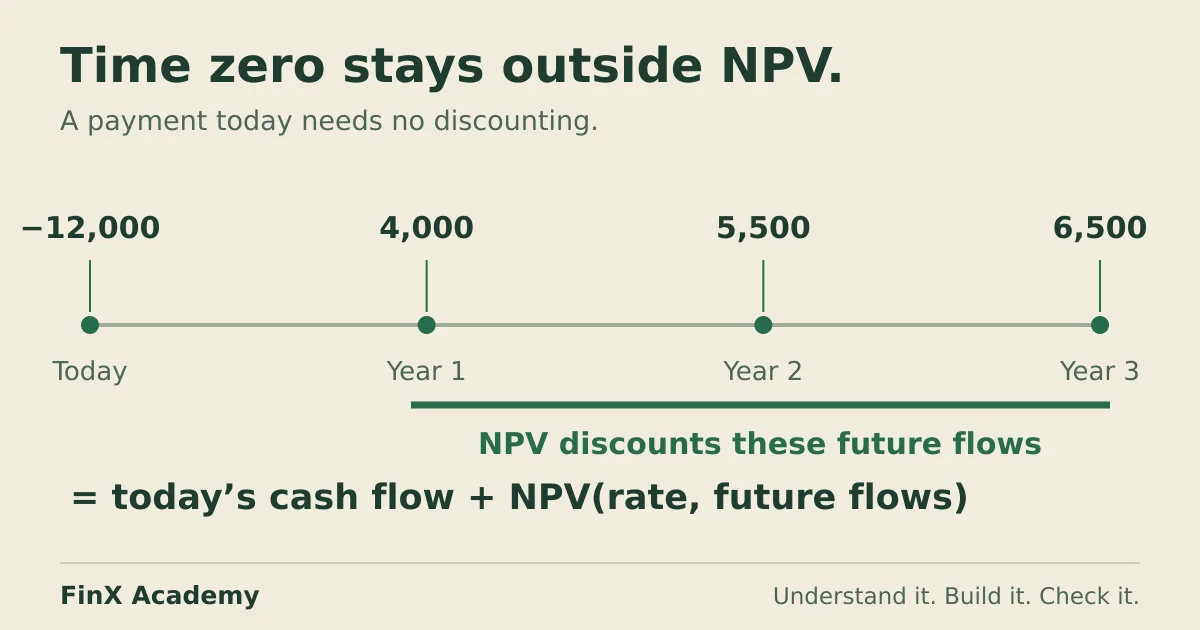
The periodic sibling of this decision — where NPV’s time-zero quirk lives — is on
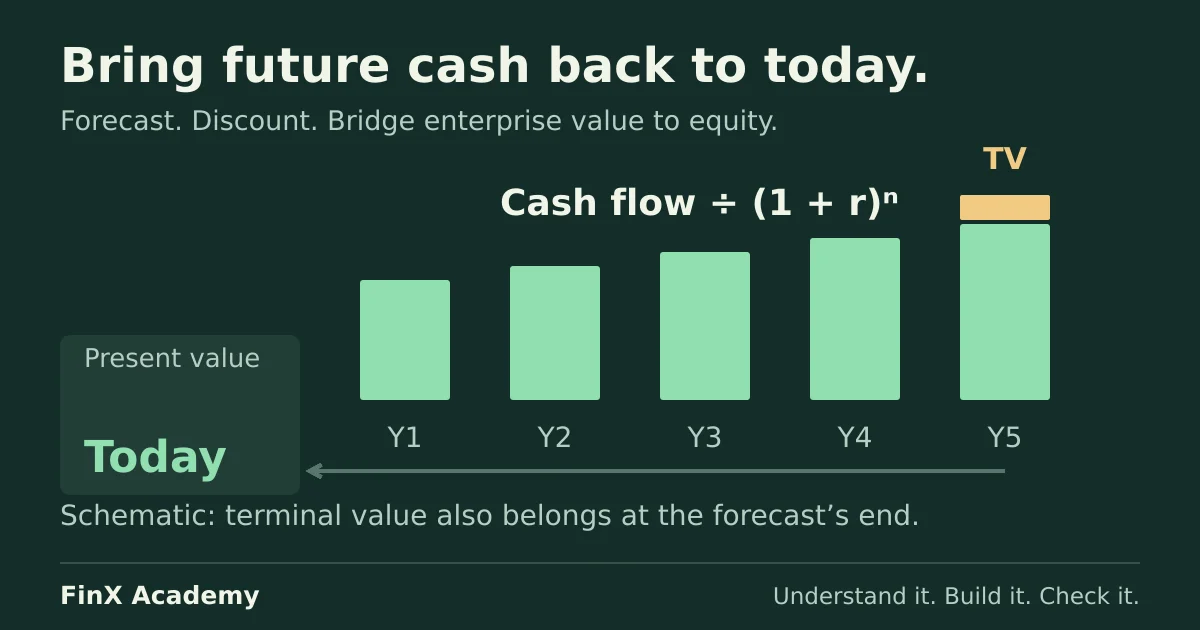
NPV in Excel; the full valuation that discounts a clean periodic forecast is the
DCF model guide, and the skills sequence that places both is
Excel for finance. FinX’s Financial Modeling & Valuation course includes valuation
practice with paid access — browse the catalogue for the current lessons. The
free ten-minute diagnostic asks five numeric modelling questions; it is not a function-lookup quiz and
does not test whether you reach for XIRR.
Continue with guided practice
Build on this guide with spreadsheet exercises on formulas, lookups and financial functions. Explore the syllabus and start with a free lesson.
Excel for Finance course