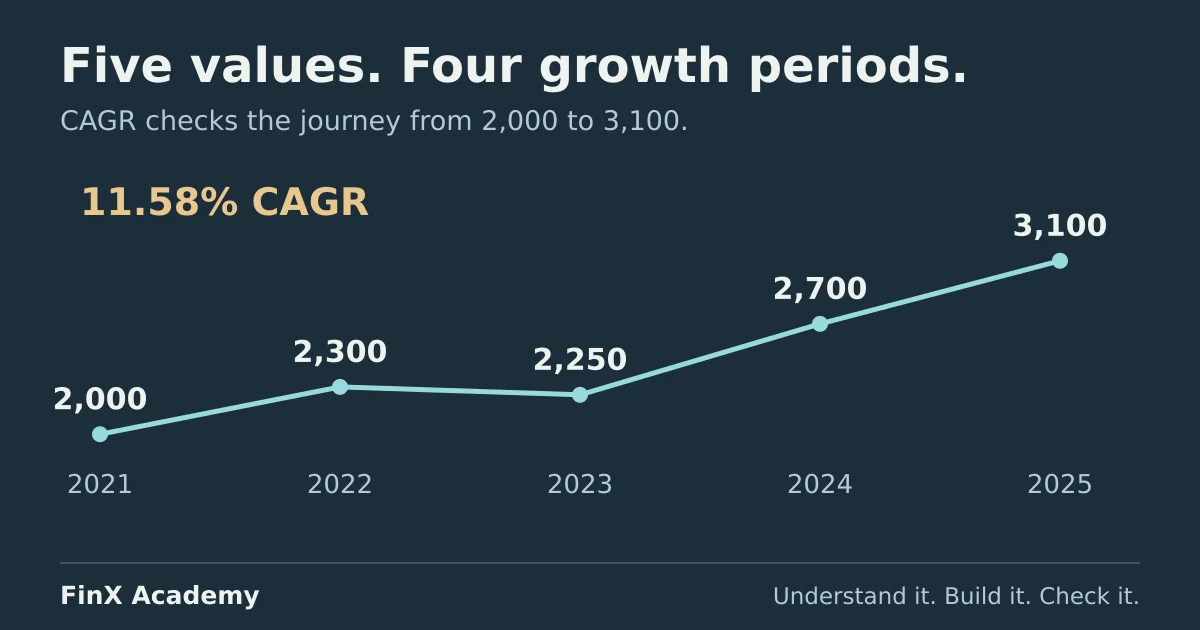
Count compounding periods, not data points: five annual revenue figures span four growth years. Verify a CAGR by compounding the start value at that rate before quoting it.
CAGR, the compound annual growth rate, is the constant yearly rate that turns a starting value into an ending value over a stated number of years. For positive starting and ending values and a positive period count, the Excel formula is:
=(end/start)^(1/n)-1The syntax is rarely the problem. The period count n is: five annual revenue figures compound over four years, and using five quietly understates the growth rate. This article builds a small revenue series, calculates its CAGR, checks the answer by compounding it back, compares it with the average of the yearly rates, and converts it to a consistent monthly rate.
Set up a five-year revenue series
Use a blank worksheet. These are fictional annual revenues for one company in thousands of dollars, one fiscal year per row. Enter the headers in row 2 and the data in rows 3–7:
| Row | A: Fiscal year | B: Revenue ($000) |
|---|---|---|
| 3 | 2021 | 2,000 |
| 4 | 2022 | 2,300 |
| 5 | 2023 | 2,250 |
| 6 | 2024 | 2,700 |
| 7 | 2025 | 3,100 |
Enter the years and revenues as numbers. Put Year-over-year growth in D2; you will fill column D in the next step.
Calculate each year’s growth first
Before computing any average, look at the path. Put this formula in D4 and copy it down to D7:
=B4/B3-1Format column D as a percentage. The four results are 15.0%, −2.2%, 20.0% and 14.8%. Leave D3 empty: FY2021 has no prior year in this table, so it has no growth rate. That empty cell is the first hint of the period-count rule — five revenue figures produce only four growth rates.
The growth path is uneven: a strong FY2022, a decline in FY2023, then two more good years. CAGR summarises that whole path as one rate.
Calculate the CAGR and check it
Count the periods in a cell rather than in your head. Put Growth periods (n) in A9 and this formula in B9:
=ROW(B7)-ROW(B3)The result is 4: the ending row minus the starting row. Put the labels and formulas below in rows 10–11:
| Cell | Label / formula | Result |
|---|---|---|
A10 |
CAGR | |
B10 |
=POWER(B7/B3,1/B9)-1 |
11.58% |
A11 |
Check: compound FY2021 at the CAGR | |
B11 |
=B3*(1+B10)^B9 |
3,100 |
POWER(B7/B3,1/B9) raises the total growth factor, 3,100/2,000 = 1.55, to the power 1/4; subtracting 1 converts the factor into a rate. The ^ operator form =(B7/B3)^(1/B9)-1 returns the same value — Microsoft’s POWER documentation notes the two are interchangeable. The result is approximately 11.579118%; format B10 as a percentage and let Excel display 11.58% while downstream formulas keep full precision.
The check in B11 is the part worth building into every model: compounding 2,000 at the full-precision rate in B10 for four years returns 3,100. A rate that reproduces the ending value from the starting value over the correct period is consistent with the data.
Excel also has a purpose-built function. =RRI(B9,B3,B7) — number of periods, present value, future value — returns the same 11.58%. See Microsoft’s RRI documentation for syntax and supported editions; use the power formula if your spreadsheet does not recognise RRI.
Why not average the yearly growth rates?
Put Average of yearly rates in A12 and =AVERAGE(D4:D7) in B12. The result is 11.91% — close to the CAGR, but not the same number, and the difference is not rounding.
Test the average the same way you tested the CAGR. Put Check: compound FY2021 at the average in A13 and =B3*(1+B12)^B9 in B13. The result is about 3,137, not 3,100. Growing at 11.91% per year overshoots the actual ending revenue.
The arithmetic average gives each year’s rate equal weight, while compounding applies the rates to changing bases. The −2.2% year shrinks the base that the following 20% grows from. With positive revenue values and equally spaced years, varying yearly rates have an arithmetic average above their compound rate. Use the CAGR when one summary rate is needed, the yearly rates in column D when the path matters, and say which one a number is.
A declining series uses the same starting value and period count: if FY2025 revenue were 1,600 instead of 3,100, the four-year CAGR would be (1600/2000)^(1/4)-1 = −5.43%. Compounding the original 2,000 at that full-precision rate for four years returns 1,600.
Catch the off-by-one period count
The most common CAGR error is counting data points instead of growth periods. =COUNT(B3:B7) returns 5 — five revenues — and it is tempting to plug that into n:
=POWER(B7/B3,1/COUNT(B3:B7))-1This returns 9.16%. The number looks plausible, which is what makes the error dangerous: it survives a glance and lands in the deck. Run the same compound-back check: 2,000 grown at 9.16% for four years reaches only about 2,840, not 3,100. The rate is wrong because it spreads the growth over a year that does not exist. In fact, 2,000 compounded at 9.16% reaches 3,100 after five years — the formula has quietly pushed the target into FY2026.
The rule: n equals the number of compounding periods. For consecutive annual figures, that is one fewer than the number of data points, and ROW(end)-ROW(start) computes it from the table itself — unlike a hard-coded 4, it stays correct when you insert another fiscal year. The row-based count does assume the years are consecutive: if a fiscal year is missing from the middle of the series, count the elapsed years from the year labels instead, such as =A7-A3, which returns 4 regardless of how many rows the data occupies.
Convert the annual CAGR to a monthly rate
A monthly reporting model needs a monthly rate consistent with the annual 11.58%. Put the labels and formulas in rows 15–17:
| Cell | Label / formula | Result |
|---|---|---|
A15 |
Monthly equivalent (effective) | |
B15 |
=(1+B10)^(1/12)-1 |
0.917% |
A16 |
Check: compound the monthly rate 12 months | |
B16 |
=(1+B15)^12-1 |
11.58% |
A17 |
Wrong: divide by 12 | |
B17 |
=B10/12 |
0.965% |
The effective monthly rate displays as 0.917%: compounding the full-precision B15 value for twelve months returns the annual 11.58%, as the check in B16 shows. Simply dividing by 12 gives 0.965%, and compounding that rate for twelve months gives 12.21% — the model would grow revenue faster than the annual assumption it came from. Dividing a quoted nominal annual rate by 12 can be appropriate when its convention specifies monthly compounding. It does not convert an effective annual growth rate: that needs =(1+annual)^(1/12)-1. Replace 12 with the number of equal subperiods per year for another frequency.
Dated values and series that break the formula
Two situations need a different tool:
- Actual dates instead of fiscal-year labels. Microsoft’s CAGR support page recommends the XIRR function: enter the starting value as a negative number on its date and the ending value as positive on its date, for example
=XIRR(E3:E4,F3:F4)withE3= −2,000 at 31 Dec 2021 andE4= 3,100 at 31 Dec 2025. XIRR counts actual days on a 365-day basis, so its answer can differ slightly from the period-count formula — here it returns about 11.57%, because the span includes a leap year. For dated investments and cash flows, that day-count accuracy is the point. - Zero or negative values. A zero starting value causes division by zero. If the endpoints have opposite signs, the ratio is negative and a fractional power can produce
#NUM!. Two negative endpoints can produce a numeric result, but it is misleading as a growth measure: a loss narrowing from −500 to −100 is an improvement even though the ratio is 0.2. For losses, sign changes or growth from zero, report the absolute change and the yearly figures instead of forcing a standard CAGR onto them. The percentage change guide works through the same base-value traps in a single-period variance table.
Also keep Microsoft’s comparison rule in mind: CAGRs are only comparable when calculated over the same period length. A three-year CAGR next to a five-year CAGR is not an apples-to-apples ranking.
Make the check a habit
A CAGR is a claim: “this series grew as if it compounded at this rate every year.” The claim is cheap to verify — compound the start value forward at the calculated rate and confirm you land on the end value — and the verification catches both classic errors, the off-by-one period count and the arithmetic-average substitute. Where the rate feeds a forecast, as it does in the three-statement model and the DCF terminal-growth assumption, the same compound-back check belongs next to the assumption cell.
To practise the underlying mechanics — growth factors, percentage changes and cell references — work through the Excel for finance budget report, then browse the course catalogue for the Mathematical Functions lesson and current access requirements. You can also take the free five-question modeling test to find which skill to sharpen next.
Continue with guided practice
Build on this guide with spreadsheet exercises on formulas, lookups and financial functions. Explore the syllabus and start with a free lesson.
Excel for Finance course