A budget is the approved plan, frozen with its version and date; a forecast is the current expectation, stamped as-of a date. Update the forecast row and bridge the variance — never edit the budget in place.
A budget quantifies what the organisation decided to do: an approved plan, versioned and frozen. A forecast quantifies what the organisation now expects: a dated re-estimate that absorbs actuals and revised assumptions. The whole difference fits in one sentence — the budget answers what should happen, the forecast answers what is now expected to happen — but the working difference is where errors live: which row a closed month writes into, which row nobody may edit, and what a plan-to-forecast variance actually decomposes into.
| Budget | Forecast | |
|---|---|---|
| Status | Approved (version, date, approver) | Current expectation (as-of date) |
| Changes when | Re-baselined formally, if ever | Actuals close or assumptions change |
| Answers | What are we committing and resourcing? | Where do we now expect to land? |
| Compared with | Actuals, for performance | Its own prior versions, for what moved |
This page builds one small case that shows all three comparisons — budget-to-actual, forecast-to-actual and
forecast-over-forecast — on dated monthly data. Amounts are FY2027 revenue in thousands of one currency for a
fictional lab-instrument parts distributor; the company plans on calendar months and closes each month’s ledger
within five working days. No Excel function is taught here: SUM and subtraction carry every number, and the
Excel for finance guide and the
percentage change guide own the mechanics.
The plan: BUD-27 v1.0, approved 20 November 2026
Months sit across B3:M3, annual figures in N, one line per version — budget in row 4, the actuals row below
it in row 6, FCST-27-01 in row 10 and FCST-27-02 in row 12. Keep each forecast snapshot; use =SUM(B4:M4) in N4 and the corresponding row formula in N6, N10 and N12. For the actuals row, label N6 as year-to-date until December closes. The budget is the only row anyone types first, and it never changes again this
year without a formal re-baseline:
| Line | Jan | Feb | Mar | Apr | May | Jun | Jul | Aug | Sep | Oct | Nov | Dec | Year |
|---|---|---|---|---|---|---|---|---|---|---|---|---|---|
| Budget (BUD-27 v1.0) | 80 | 84 | 92 | 96 | 96 | 104 | 88 | 88 | 100 | 108 | 116 | 128 | 1,180 |
The shape is deliberate: Q1 is 256 of 1,180 — about 21.7% of the year — and Q4 alone carries 352. Hold that; the
annualising trap at the end of the page is entirely a function of this seasonality. Quarter subtotals
(=SUM(B4:D4) onward) are 256, 296, 276 and 352, and the four subtotals must sum to =SUM(B4:M4) — two routes to
every annual figure from the first version onward.
Record actuals only in closed months
Q1 closes on 5 April 2027. The actuals row receives January, February and March — and nothing else:
| Line | Jan | Feb | Mar |
|---|---|---|---|
| Actual (closed 5 Apr) | 78 | 90 | 87 |
| Actual − budget | −2 | +6 | −5 |
| Reason recorded | Slow restart | One-time bulk order | Shipment slipped into April |
The variance cell is =B6-B4 (actual minus budget), and the percentage is =(B6-B4)/B4 — with the zero-base and
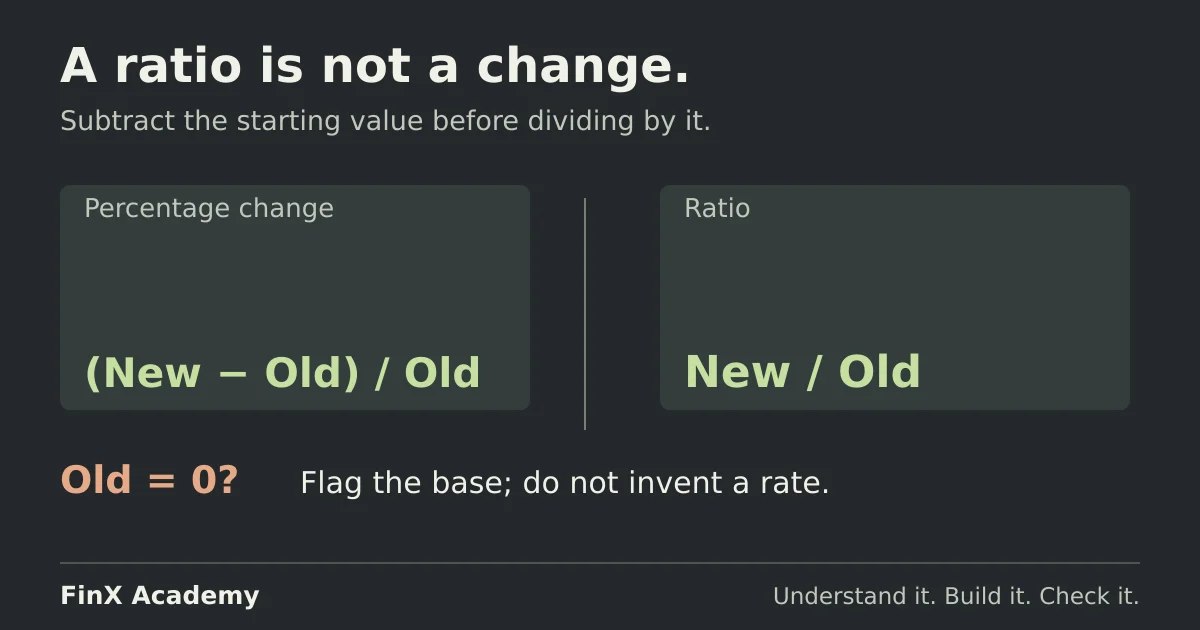
negative-base guards the percentage change guide works through. The sign
convention follows the Excel for finance budget report: on a revenue line a positive
variance is favourable; the identical +20 on an expense line means overspending, and a clean total can hide
offsetting detail.
Q1 actual is 78 + 90 + 87 = 255 against a budget of 256: elapsed variance −1. Three properties of that −1 already matter for the forecast: the February +6 is a one-time bulk order that does not repeat; the March −5 is a shipment that slipped, not a lost sale, and is expected to recover in April; only January’s −2 is plain softness. Those causes should inform the forward assumptions individually.
Update the forecast row, never the budget
FCST-27-01 is prepared on 6 April 2027. Its rule: January–March are locked actuals, April–December are the current expectation, and every forward change traces to a dated, named decision:
| Line | Jan | Feb | Mar | Apr | May | Jun | Jul | Aug | Sep | Oct | Nov | Dec | Year |
|---|---|---|---|---|---|---|---|---|---|---|---|---|---|
| FCST-27-01 (as of 6 Apr) | 78 | 90 | 87 | 101 | 96 | 104 | 85 | 85 | 97 | 112 | 120 | 132 | 1,187 |
The three decisions behind it:
- The slip recovers. April = 96 + 5 = 101; the March shortfall was timing, and the +5 is dated where it reappears.
- A price increase slips from 1 July to 1 October. July, August and September drop 3 each (88→85, 88→85, 100→97); a separately revised, larger increase raises October–December by 4 each above the approved budget, not merely above September (108→112, 116→120, 128→132). The decision lives in the affected months only — not spread across the year.
- May and June stay at budget pending the pipeline review. “Still at plan” is itself a recorded, dated judgement, not a blank.
February’s +6 stays a one-off: it is in the actuals, and it appears nowhere in the forward months.
Bridge the plan to the forecast
The headline moved from 1,180 to 1,187, and the two-step bridge explains every unit of it:
| Step | Amount | Running total |
|---|---|---|
| BUD-27 v1.0 (approved 20 Nov 2026) | 1,180.0 | |
| Elapsed variance, Q1 actual − Q1 budget | −1.0 | 1,179.0 |
| Recover March slip in April | +5.0 | 1,184.0 |
| — recovery-only benchmark | 1,184.0 | |
| Price rise deferred: Jul–Sep, 3 × −3 | −9.0 | 1,175.0 |
| Larger rise vs budget in Oct–Dec: 3 × +4 | +12.0 | 1,187.0 |
| FCST-27-01 (as of 6 Apr 2027) | 1,187.0 |
Read the two halves separately, because they answer different questions. The −1 is the budget-to-actual
result for a completed period: how the closed quarter performed against the plan. The +8 is a set of dated
forward decisions about months nobody has traded yet. The year is now expected to finish +7 above a budget
that Q1 says is being missed — both statements are true, and collapsing them into one “vs budget” column is what
makes the report hard to interpret. The recovery-only benchmark (1,184: actuals, the recovery, everything else at
plan) separates the −1 of history from the +3 the pricing decisions net to, and gives the bridge a checksum:
255 + 5 + 924 = 1,184; 1,184 − 9 + 12 = 1,187 ✓.
Roll the forecast; the plan stays put
Q2 closes on 7 July: April 103, May 94, June 106 — actual 303, +7 on Q2 budget and +2 on what FCST-27-01 predicted for those months. FCST-27-02, prepared 8 July, locks Q2 and revises the horizon:
| Line | Jan | Feb | Mar | Apr | May | Jun | Jul | Aug | Sep | Oct | Nov | Dec | Year |
|---|---|---|---|---|---|---|---|---|---|---|---|---|---|
| FCST-27-02 (as of 8 Jul) | 78 | 90 | 87 | 103 | 94 | 106 | 84 | 85 | 98 | 113 | 121 | 134 | 1,193 |
Both versions cover the same January–December year, so comparing their full-year totals is valid. Split the +6 change into April–June forecast-to-actual variance and July–December forecast revisions. January–March actuals are unchanged and omitted from the table:
| Month | FCST-27-01 (6 Apr) | FCST-27-02 (8 Jul) | Change | Reason |
|---|---|---|---|---|
| Apr | 101 | 103 | +2 | Slip recovered, plus incremental demand |
| May | 96 | 94 | −2 | One customer deferred its quarterly order |
| Jun | 104 | 106 | +2 | Repeat order landed early |
| Jul | 85 | 84 | −1 | Soft start to the deferral window |
| Aug | 85 | 85 | 0 | No change |
| Sep | 97 | 98 | +1 | Pre-increase pull-in orders visible |
| Oct | 112 | 113 | +1 | Price rise confirmed by bookings |
| Nov | 120 | 121 | +1 | Price rise confirmed by bookings |
| Dec | 132 | 134 | +2 | Price rise plus a year-end bulk contract |
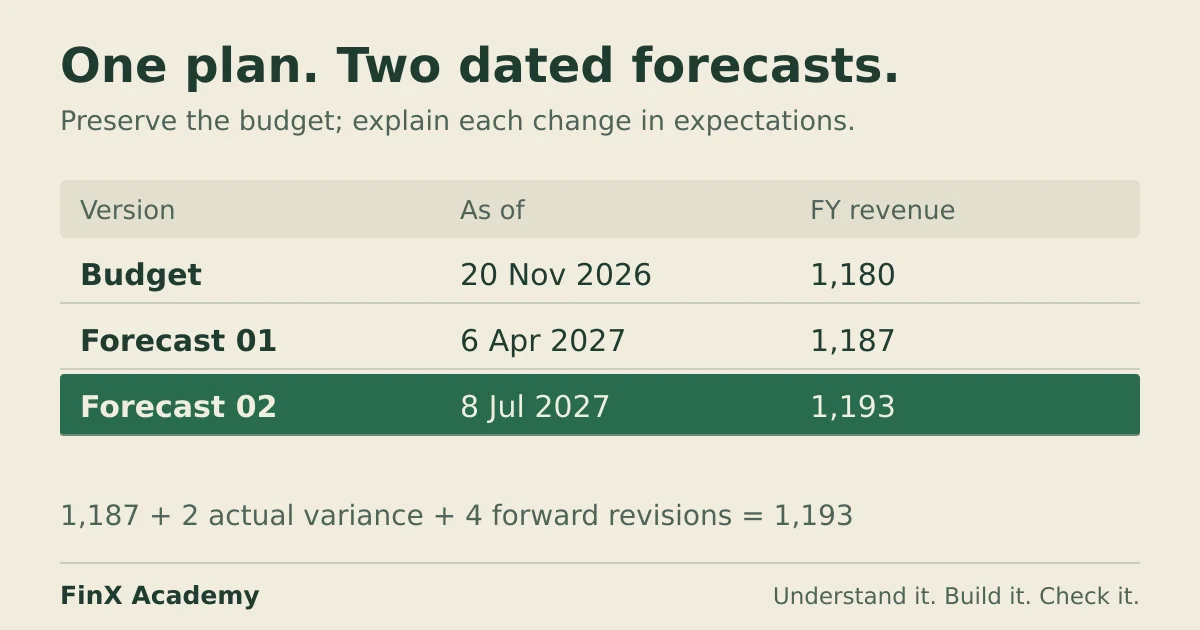
The FY bridge rolls forward the same two-step way: 1,187 plus +2 of newly closed actual variance plus +4 of forward revisions (−1 + 0 + 1 + 1 + 1 + 2) = 1,193, which is +13 against the unchanged 1,180 budget. The three comparison pairs each earned their keep: budget-to-actual says how the closed half-year performed (+6: −1 then +7); forecast-to-actual says how accurate the April prediction was for Q2 (+2); forecast-over-forecast says what changed since then (+4).
Three checks before the pack circulates
- Two routes to the year.
=SUM(B12:M12)must equal the four quarter subtotals: 255 + 303 + 267 + 368 = 1,193 ✓ (and for FCST-27-01: 255 + 301 + 267 + 364 = 1,187 ✓). - The period lock. For every closed month, the actual cell minus the current forecast cell must be zero —
=B6-B12across the closed range. A nonzero means a projection is hiding inside a completed period. This is the one flag that keeps three versions on one sheet honest, and it fails silently: the totals all look fine while someone has forecast their way through a month that already happened. - The bridge closes. Plan + elapsed + forward = forecast, per version: 1,180 − 1 + 8 = 1,187 ✓ and 1,187 + 2 + 4 = 1,193 ✓. Each component must name its dated decision; a plug that makes the bridge balance is the same offence as editing the budget.
Break it, and see what each error looks like
1. Rewriting the plan. It is December, and a colleague edits the March budget cell from 92 to 87 “so the Q1 report reads clean.” The FY budget silently becomes 1,175, the Q1 budget-to-actual flips from −1 to +4, while April remains +7 against its unchanged 96 budget. Editing March has not changed April; it has erased the original Q1 benchmark. Nothing else on the sheet changes — which is exactly why this error survives review. What was lost is the only thing a budget is for: a fixed benchmark. If leadership genuinely changes the commitment, re-baseline formally — BUD-27-R2, dated, approved — so both plans remain in the record.
2. Annualising a quarter. Take Q1’s 255 and multiply by four: 1,020, a “−160 to plan.” But the budget
itself earns only 256/1,180 of the year in Q1, so the seasonal-shape route is 255 × 1,180 ÷ 256 = 1,175.4.
Almost the entire 155.4 gap between 1,020 and 1,175.4 is period shape, not performance — four quarters are
not the same size. Scale by the plan’s own distribution if you must scale, and drive the remaining months with
drivers instead: that is the
revenue-forecast build, which models volumes and prices month by month rather than
restating one period four times.
3. Forecasting a closed month. Replace February’s locked 90 with the old budget 84 and the FY prints 1,187 —
still plausible, still wrong. The forecast total loses 6 even though the actuals and the budget-to-actual calculation remain unchanged. The period-lock check catches this mismatch (=C6-C12 =
+6 ≠ 0). A forecast is allowed to change its mind about July; it must tie closed months to the ledger. If the ledger is corrected, retain the old snapshot and label the actuals restatement explicitly.
For the forward months’ “what if” spread, the scenario analysis guide builds base/upside/downside cases on one switch, so the forecast stays a single dated expectation while the range around it stays explicit.
Check your answers
- Budget FY 1,180 (quarters 256, 296, 276, 352); Q1 actual 255, elapsed variance −1.
- FCST-27-01 months 78, 90, 87, 101, 96, 104, 85, 85, 97, 112, 120, 132; FY 1,187; bridge −1 + 8; no-decision benchmark 1,184.
- FCST-27-02: Q2 actual 303; months 78, 90, 87, 103, 94, 106, 84, 85, 98, 113, 121, 134; quarters 255/303/267/368; FY 1,193 = 1,187 + 2 + 4; +13 vs budget.
- Annualising: 255 × 4 = 1,020 versus the seasonal route 1,175.4 — a 155.4 difference that is shape, not performance.
- Rewritten plan: FY budget 1,175, Q1 variance +4; April stays +7 against its unchanged budget.
Practise the report layer next
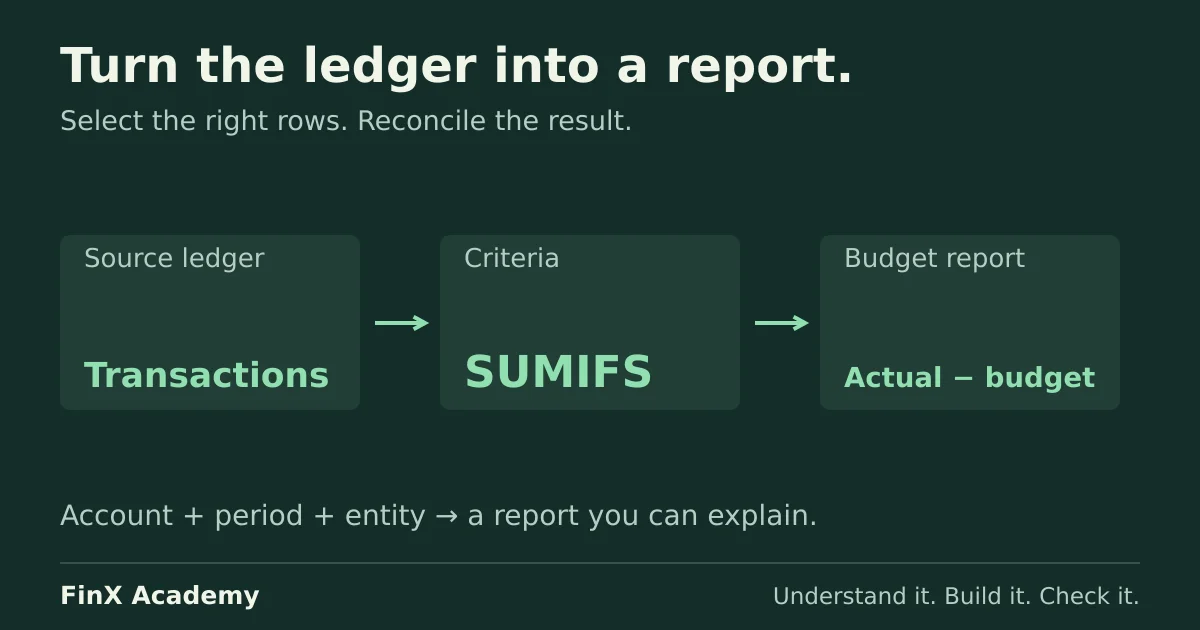
This page is the planning discipline around one line; building and checking the month-against-budget report itself — selection, aggregation, the sign convention and offsetting detail — is the worked case on the Excel for finance guide. FinX’s Excel for Finance course covers those areas — foundations, lookups, aggregation and data hygiene, model mechanics, and financial functions — with browser spreadsheet practice; Mathematical Functions and Anchoring & the Grid are free, and the later lessons require paid access. Browse the catalogue for the current syllabus. The free ten-minute diagnostic asks five numeric modelling questions; it does not grade a variance bridge or version control.
Continue with guided practice
Build on this guide with spreadsheet exercises on formulas, lookups and financial functions. Explore the syllabus and start with a free lesson.
Excel for Finance course