Preserve the source, explain each transformation and keep unresolved items visible.
Turn inconsistent source files into a dataset that another analyst can trace and reproduce. Nine free written lessons cover financial sources, periods, LTM, units, currencies, restatements, missing values, duplicates, account mapping and reconciliation.
Prerequisites: financial numeracy, Excel foundations and accounting for analysts. All Alder company facts are fictional teaching data.
Download the editable workbook and complete source pack. The pack preserves the original files, dated source register and a separately labelled worked solution. Try the case before opening the solution. The IDE offers six free starter exercises and 21 further exercises with full access.
1. Choose a source that answers the question
A number needs an identity before it needs a formula. Revenue of 750 could mean one subsidiary, the whole group, a quarter, six months, dollars or thousands of dollars. Write the entity, metric, dates, currency, scale, accounting basis and source version beside it. A filing’s publication date is not the period it describes.
For listed US companies, start with the filed annual and interim reports and their notes. A 10-K contains annual financial statements and a 10-Q supplies interim information. An earnings release can be faster, but its adjusted measures and preliminary status require their own reconciliation. For an internal analysis, a controller-approved ledger may supply account detail absent from the statements. A vendor export is useful for discovery; trace important figures back to the underlying report.
This is a hierarchy for a specific question, not a universal rule that one file always wins. Issued statements control reported totals in our case. The ledger explains their composition. When they disagree, record the difference and investigate cutoffs, scope, elimination entries and versions. Do not choose the value that makes the model balance.
Alder example. S03 reports consolidated H1 2026 revenue of USD750 thousand. The earlier draft S05 reports 752. The final issued interim report controls the current total, so use 750. Keep the draft with a disposition explaining the replacement. S04 has a credit-signed sales amount of −750,000 USD units; after a documented sign and scale conversion it agrees with 750. These are three representations of related evidence, not three revenues to add.
Try it. Record a source entry for S03: S03; issued 2026-08-15; Alder consolidated; revenue; 2026-01-01 to 2026-06-30; USD thousands; issued interim; income statement. Identify the question S04 answers that S03 cannot.
Worked answer. S04 supplies account-level detail and an unresolved account. It supports the composition of operating expenses. It does not replace the issued statement’s authority or establish that every account is correctly classified.
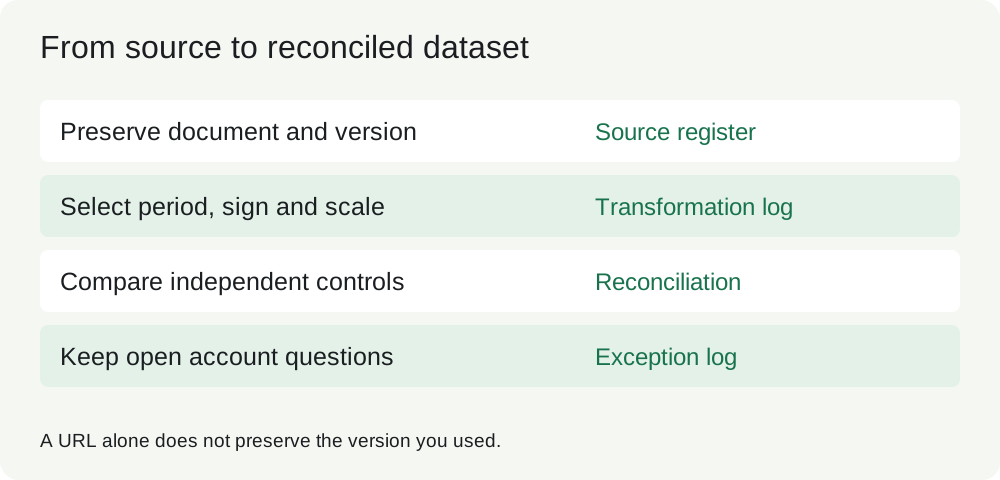
Transfer check. If a vendor changes yesterday’s revenue history today, what would let you reproduce yesterday’s analysis? Retain the downloaded snapshot, retrieval date, document identifier, content hash and the version-selection decision. A URL alone can change.
Source guidance: SEC guide to 10-K and 10-Q reports. All Alder documents are original fictional teaching sources.
2. Align periods before comparing numbers
Separate flows over an interval from stocks at a date. Revenue and expense cover time. Cash and debt describe a reporting date. Adding four quarterly revenues can form a year if the intervals are complete, adjacent and nonoverlapping. Adding four quarter-end cash balances has no useful annual-cash meaning.
A year-to-date figure is cumulative. If first-half revenue is 660 and Q1 revenue is 310, standalone Q2 revenue is 350. Adding 310 and 660 would count Q1 twice. Check the start date even when the column heading merely says “Q2”. Cash-flow statements often use cumulative periods.
For a December year-end, H1 2025 means January 1 through June 30, 2025. A June year-end company’s FY2025 can mean July 1, 2024 through June 30, 2025. Store both dates and the issuer’s fiscal-year label. Do not relabel a fiscal year as a calendar year. A 52/53-week retailer also needs the week count; a longer year can inflate apparent growth.
| Observation | Start | End | Correct treatment |
|---|---|---|---|
| FY2025 revenue | 2025-01-01 | 2025-12-31 | Annual flow |
| H1 2025 revenue | 2025-01-01 | 2025-06-30 | Six-month flow |
| H1 2026 revenue | 2026-01-01 | 2026-06-30 | Six-month flow |
| Cash at June 30, 2026 | — | 2026-06-30 | Instant; no LTM sum |
Try it. Alder has Q1 revenue 310 and H1 revenue 660. Calculate Q2 and the H1 control. Then explain whether H1 revenue 750 is a full-year forecast of 1,500.
Worked answer. Q2 is 660 − 310 = 350. Q1 plus Q2 returns 660. Multiplying H1 by two is an annualized run rate based on an assumption of equal halves, not an observed year or an LTM calculation. Seasonality, acquisitions and changes in scope may make that assumption poor.
Transfer check. A new acquisition enters consolidation in April. Aligned dates alone do not establish organic growth. Identify the scope change separately; do not invent a pro forma comparison without supported acquisition-period information.
3. Build a trailing twelve-month period
LTM means the last twelve months through a stated date. For a flow with comparable definitions and matching year-to-date intervals:
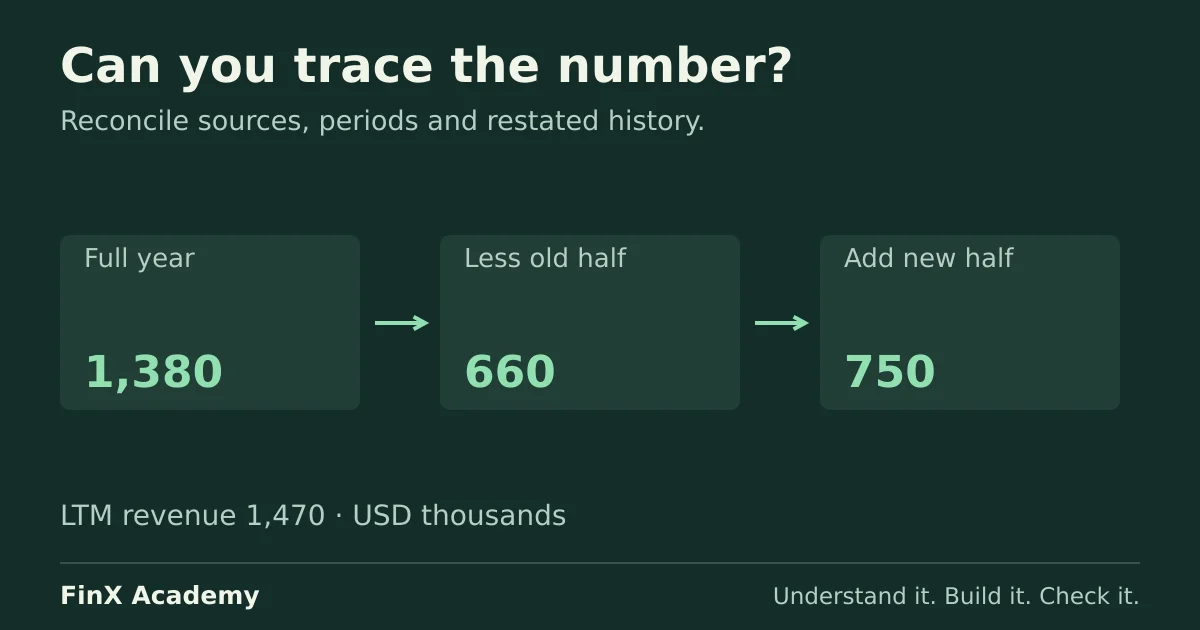
LTM = latest full fiscal year − prior-year YTD + current-year YTD
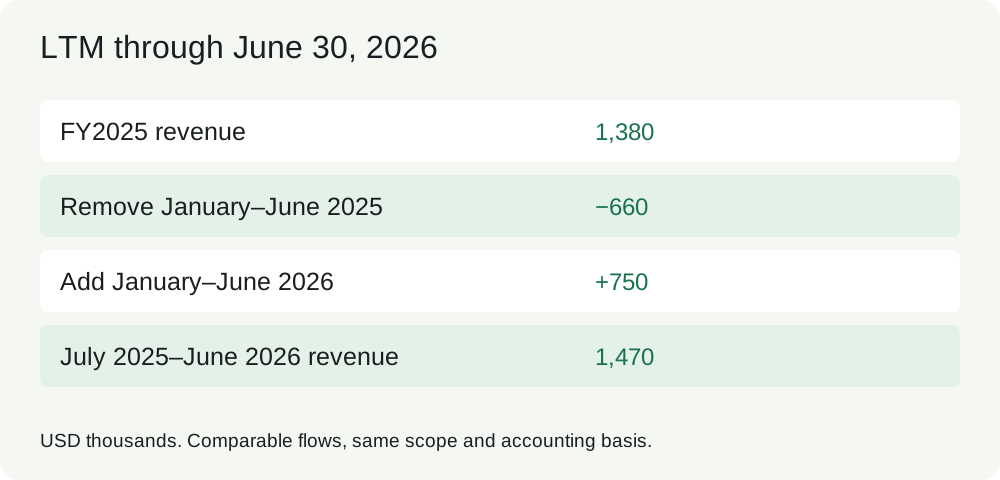
At June 30, 2026, subtract January–June 2025 from calendar 2025, leaving July–December 2025. Add January–June 2026. The resulting interval is July 1, 2025 through June 30, 2026.
| USD thousands | FY2025 | Less H1 2025 | Add H1 2026 | LTM June 2026 |
|---|---|---|---|---|
| Revenue | 1,380 | 660 | 750 | 1,470 |
| Cost of sales | 828 | 396 | 450 | 882 |
| Operating expenses | 330 | 156 | 180 | 354 |
| EBIT | 222 | 108 | 120 | 234 |
In a worksheet with the three inputs in C3:C5, enter =C3-C4+C5. An independent check uses the retained half-year: 720 + 750 = 1,470 revenue. EBIT can be calculated from the LTM components or by the same period bridge; both give 234. This equality checks arithmetic and component consistency, not the truth of every source.
Try it. Increase H1 2026 revenue by 15 with expenses unchanged. LTM revenue becomes 1,485 and EBIT becomes 249. Restore the input. If the output stays fixed, it is a typed result or a broken link.
LTM margins use LTM profit divided by LTM revenue, so EBIT margin is 234 / 1,470 = 15.92%. Never add or average published margins without their weights. EPS, weighted shares and nonadditive operating statistics also require their own definitions; do not apply the flow bridge blindly.
Transfer check. If the current interim report restates the prior-year half, use that same basis in the full-year amount. A restated YTD subtracted from an unreconciled original year can create an artificial remainder. If the comparable full-year bridge is unavailable, mark the LTM unavailable and name the missing evidence. Do not use zero for a missing quarter.
4. Normalize units, signs and currencies separately
Preserve the raw amount and record each transformation. Alder’s sales ledger uses credit-negative signs in USD units. Its analysis uses positive revenue in USD thousands. The conversion is −750,000 × −1 / 1,000 = 750. Formatting a cell as “USD thousands” would not perform either operation.
Expense balances in this P&L extract are debit positive, so 450,000 becomes cost of sales 450. Avoid ABS as a universal cleanup rule: it would turn a legitimate refund or expense reversal into an addition. Use the declared account sign convention and keep reversals signed relative to it.
Currency conversion is a different step. If an original practice item is EUR200 thousand and the rate is USD1.10 per EUR, its translated amount is USD220 thousand. If the rate is quoted as EUR per USD, the arithmetic is division instead. Write the direction, rate date or period, source and method next to the rate.
For translating a foreign operation under IAS 21, assets and liabilities generally use the closing rate, while income and expenses use transaction-date rates; a period average may approximate them when appropriate. Equity and translation differences need further treatment. This lesson’s conversion lab is a limited analytical illustration, not a complete consolidation. A large currency fluctuation can make a simple average inappropriate.
Try it. Convert EUR200 thousand of revenue using a fictional period average of USD1.10/EUR. Convert EUR80 thousand of closing cash using USD1.15/EUR. The answers are revenue 220 and cash 92, both in USD thousands. Different rates reflect different measurement contexts.
S05’s subsidiary memo is already included in consolidated S03 revenue. Do not add the converted 220 to Alder’s 750. Correct arithmetic cannot repair an incorrect population. The subsidiary memo is excluded from the consolidated sum with that reason retained in the source log.
Transfer check. A workbook shows 0.75 with a label “USD millions”; another shows 750 with “USD thousands”. They agree. Express both in one scale before calculating a difference, and keep full precision until presentation rounding.
Reference: IFRS Foundation, IAS 21. Rates in this course are fictional assumptions.
5. Keep a restatement bridge
A later report can revise a previously reported year. Keep both versions, but select one consistent basis for a comparison. Store the original amount, correction, revised amount, affected period, reason, source and selection date. “Latest file wins” is insufficient when a new file covers only part of the history or a different scope.
Alder’s S02 note R1 corrects premature FY2024 revenue of 20 and related cost of sales of 10, in USD thousands. The transaction belonged outside FY2024. The case supplies the corrected comparison; learners are not being asked to decide the issuer’s accounting treatment.
| FY2024, USD thousands | Original S01 | Correction S02 R1 | Restated S02 |
|---|---|---|---|
| Revenue | 1,200 | −20 | 1,180 |
| Cost of sales | 720 | −10 | 710 |
| Operating expenses | 300 | 0 | 300 |
| EBIT | 180 | −10 | 170 |
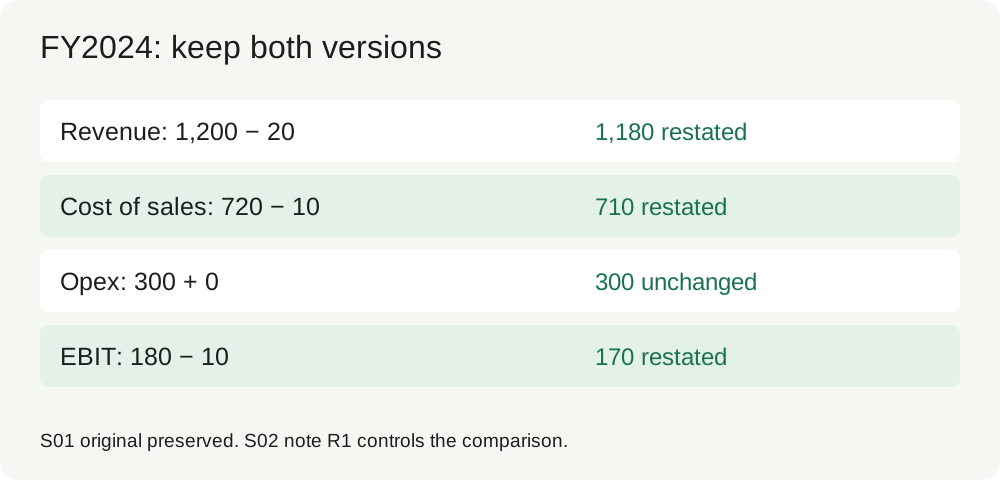
Original EBIT is 1,200 − 720 − 300 = 180. Restated EBIT is 1,180 − 710 − 300 = 170. The profit correction is −20 − (−10) = −10; it is not −30 because reducing an expense offsets part of the revenue reduction.
Try it. Calculate FY2025 revenue growth using 1,380 and the comparable restated base. The answer is 1,380 / 1,180 − 1 = 16.95%. The original 1,200 base would show 15.00%. Explain the 1.95 percentage-point difference as a base-version effect rather than new FY2025 sales.
Record: “Selected S02 FY2024 restated values for comparison with FY2025. S01 preserved as superseded. Reason: premature sale and associated cost corrected in note R1. EBIT decreased by 10. No additional correction is applied to FY2025.” Adding original and restated rows would double count the year. Applying the correction twice would understate it.
IAS 8 distinguishes correction of material prior-period errors from changes in estimates, and ordinarily requires retrospective correction of those errors unless impracticable. Reclassification may change presentation without changing profit; it still requires a mapping bridge. Describe which situation the actual source reports.
Transfer check. A useful-life estimate changes prospectively. Do not invent a historical restatement just because a new assumption exists. Follow the source disclosure and retain an explanation of comparability.
Reference: IFRS Foundation, IAS 8, checked 8 October 2026. The case is an income-statement exercise; it does not supply the balance-sheet or tax effects of the correction.
6. Preserve missing values and resolve duplicates
Zero means an observed amount of zero. A blank may mean missing, not disclosed or not applicable. Give these states explicit meanings. If a report does not separately disclose D&A, you cannot conclude that EBITDA equals EBIT. An unavailable result with a named missing input is more informative than a fabricated zero.
An exact lookup can match a row whose value is blank. Likewise, SUMIFS can return zero when no rows match. Count coverage and validate required values as well as the numerical result. Use IF(COUNT(C3:C5)=3,C3-C4+C5,"Unavailable") for a three-input LTM lab: a genuine numeric zero counts; a missing input does not. This guard is for that specific requirement, not a reason to hide every error with IFERROR.
Define duplicate identity at the data’s grain. In S04, the controlled key is entry ID + account for this one-entity, one-period, one-currency P&L export. A production key would also include those dimensions and any line identifier needed for split postings. Account code alone is not a transaction key: many legitimate entries can use it.
P003 and P006 both contain JE003, account 6000, payroll 140,000. The controller confirms a repeated export row. Retain P003 once and log P006 as its exact duplicate. The ledger contains six rows but five unique entries. Never delete the original row from the preserved source.
Try it. Sum payroll before and after deduplication. The raw export contains 280,000; the retained payroll is 140,000. The raw net P&L sum is 20,000 debit, but removing the duplicate makes it −120,000, representing a credit net profit of 120,000 in this partial P&L extract. This is not a trial-balance balancing test.
If P006 said 142,000, the same key would have conflicting values. Stop automatic selection and seek the posting or version rule. “Keep first”, “keep latest” and “use the average” would conceal a business decision unless evidence supports one of them.
Transfer check. Two distinct invoices both contain a 140,000 payroll charge. Equal amounts do not prove a duplicate. Preserve valid repeated transactions, and document why your key identifies one observation.
7. Map accounts without hiding exceptions
A mapping table connects source account identity to an analytical category. Use a stable account code, the relevant entity or chart version, an effective period when needed, a category and a documented sign rule. A description helps a reviewer but can change spelling or language. Do not strip leading zeros from identifiers merely because they look numeric.
| Account | Analysis category | Raw-to-analysis sign |
|---|---|---|
| 4000 | Revenue | −1 |
| 5000 | Cost of sales | +1 |
| 6000 | Payroll | +1 |
| 6100 | Other operating costs | +1 |
| 6999 | Unmapped | Unresolved; keep stated debit sign |
Check mapping uniqueness before retrieving a category. COUNTIF should find exactly one applicable rule for an account. Zero matches creates an exception; two matches creates ambiguity. A first-match lookup can return plausible text while hiding a conflicting mapping.
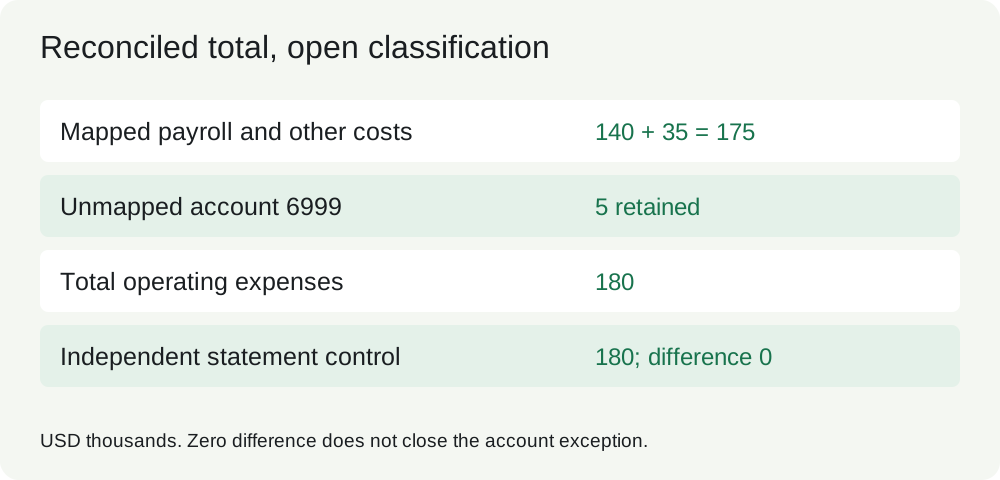
Alder’s final ledger identifies 6999 as a 5,000 debit expense in the P&L subset. Its detailed classification is missing. Keep it as unresolved operating costs, USD5 thousand, because the case’s controller source supports that broad expense scope. Do not silently call it payroll, nonrecurring, capex or a revenue offset. If the broad expense scope were also unknown, even this provisional subtotal would need to remain unresolved.
Mapped operating expenses are 140 payroll plus 35 other costs, or 175. Add the explicit unresolved 5 to obtain the issued total of 180. Excluding account 6999 would inflate EBIT from 120 to 125. Including its amount does not mean its classification is approved.
Try it. Write an exception entry containing account 6999, source S04 P005, amount 5, status open, owner Controller (case role), and action “obtain invoice and approved category”. Retain the eventual decision and supporting source when resolved. Do not guess an actual employee or a deadline the pack never supplied.
Transfer check. A mapping repair moves 5 from Unmapped to Other operating costs. Total expenses and EBIT must remain unchanged. A classification-only repair that changes profit has altered the population or sign as well.
8. Reconcile totals and preserve the path back
Reconciliation compares two independently grounded views of the same measure. First match entity, period, currency, scale, sign and definition. Then calculate a difference. Comparing a SUM with another cell linked to that same SUM only checks a link, not source completeness.
For H1 2026, compare the cleaned S04 ledger against the independently supplied S03 statement controls: revenue 750, cost of sales 450 and operating expenses 180, all USD thousands. The differences are zero. Retain the controls as sourced inputs; do not type a balancing adjustment into the ledger to force zero.
| Control | Reconciled amount | Independent S03 | Difference |
|---|---|---|---|
| Revenue | 750 | 750 | 0 |
| Cost of sales | 450 | 450 | 0 |
| Operating expenses including unresolved 5 | 180 | 180 | 0 |
| EBIT | 120 | 120 | 0 |
State the tolerance. The fictional sources supply exact unit amounts, so our numerical controls use a small floating-point tolerance of 0.000001 thousand. A real rounded filing might require a documented rounding tolerance based on its published precision. A tolerance is not an allowance to hide an unexplained difference.
Use three linked records. The source register identifies the document and immutable snapshot. The transformation log identifies input rows, selection decisions and formulas. The exception log identifies unresolved issues and owners. An output should point to its source rows through those transformations, including excluded duplicates and superseded figures.
Try it. Trace LTM revenue 1,470 backwards: S02 FY2025 revenue 1,380 minus S03 H1 2025 revenue 660 plus S03 H1 2026 revenue 750. Trace the last number to S04 P001: −750,000 × −1 / 1,000. Record that S04 is a corroborating ledger, not an extra amount in the LTM sum.
Worked review. Numerical reconciliation passes, mapping completeness fails for 6999, and EBITDA coverage fails because D&A is not supplied. These are separate statements. A single green “all good” indicator would conceal two outstanding limitations.
Transfer check. Increase the retained payroll source by 1,000. Operating expenses become 181 and their difference becomes +1, while EBIT becomes 119. Do not edit the independent control to 181 merely to make the check pass. The difference is the useful signal.
9. Case: turn the imperfect source pack into a reconciled dataset
You are preparing Alder Components’ historical analysis as of August 15, 2026. The company, documents and rates are fictional. Deliver a comparable income-statement dataset through LTM June 2026, preserve source lineage, explain the restated year, and leave an honest record of account 6999. Use the workbook and CSV source pack linked above. Try the case before reading the solution.
Deliver these five items: selected period data with explicit units; the original-to-restated FY2024 bridge; cleaned H1 2026 account detail and row dispositions; independent reconciliation differences; and a short exception handoff. The source pack contains a repeated payroll row, an older draft, an already-consolidated subsidiary memo, an unmapped account and missing D&A.
- Register S01–S05, including dates, scopes, locators and source versions. Preserve original CSVs.
- Select S02’s restated FY2024 comparison, S02 FY2025 and the two comparable halves in S03. Keep S01 as superseded, not deleted.
- Keep S04’s five unique entries. Exclude P006 only with a link to retained P003. Convert units and signs, then map the four known codes and preserve 6999 as unresolved.
- Compare cleaned ledger revenue, costs and EBIT against S03. Explain every difference before moving on.
- Calculate LTM flows, growth on the restated base and a supported handoff. Leave EBITDA unavailable.
Worked dataset
| USD thousands | FY2024 restated | FY2025 | H1 2025 | H1 2026 | LTM Jun 2026 |
|---|---|---|---|---|---|
| Revenue | 1,180 | 1,380 | 660 | 750 | 1,470 |
| Cost of sales | 710 | 828 | 396 | 450 | 882 |
| Operating expenses | 300 | 330 | 156 | 180 | 354 |
| EBIT | 170 | 222 | 108 | 120 | 234 |
The workbook exposes formulas and blank learner decision fields. The IDE’s 27 tasks check numerical work; they do not automatically certify the source-selection memo or the judgement behind a classification. Review those against the written criteria below.
Example handoff
“I used S02’s restated FY2024 amounts. Note R1 reduces revenue by 20 and cost of sales by 10, reducing EBIT by 10 to 170. FY2025 revenue growth on that basis is 16.95%. LTM through June 30, 2026 has revenue 1,470 and EBIT 234. H1 ledger totals agree to S03 after excluding exact duplicate P006 and converting USD units to thousands. Account 6999 remains an unresolved operating expense of 5, included in the 180 control total. The Controller must supply its invoice and approved category. D&A is not separately supplied, so EBITDA is unavailable. S05’s draft and subsidiary memorandum are excluded with reasons.”
Repair and retry
Change P006 to 142,000. The duplicate check must now report a conflict, not silently keep P003. Restore it. Increase P003 and its exact duplicate to 141,000; the retained expense rises by 1, the independent opex difference becomes +1 and EBIT falls by 1. Restore both values. Add a supported mapping for 6999 as Other operating costs; unmapped becomes zero while total opex stays 180. Do not pretend this hypothetical repair is evidence that the original exception is resolved.
Review criteria
A complete submission accounts for every source and row, uses one compatible version per period, preserves missing values, produces all three independent zero differences on the original data, and explains both the restatement and open mapping issue. It also updates under the retry. A numerical pass with no source log is incomplete. A clean source log with the wrong period or a balancing plug is also incomplete.
Next, use these reconciled inputs for financial statement analysis. The quality of a ratio depends on the quality of its numerator, denominator and source history.
Reconcile the source pack yourself
Start with six free exercises on sources and periods. Continue with LTM, restatements, cleanup, mapping and the Alder case in full access. Review the source-selection memo and open exception separately.
Continue with guided practice
Practise source selection, period alignment, LTM, units, currencies and transparent reconciliation.
Source data, cleanup and reconciliation course