Reconcile earnings to cash and make every adjustment traceable to evidence.
Explain the drivers, quality and cash implications of reported performance. These nine free lessons extend the existing Financial Statement Analysis course with normalization, segment economics, reinvestment and a complete earnings-quality case. The 15 existing exercises and saved progress remain in place; 12 new exercises bring the course to 27, including six free.
Prerequisites: Accounting for analysts and Source data reconciliation.
Download the editable workbook and source pack with worked solution. All Meridian facts are original fictional teaching data in USD millions. The numerical exercises check formulas. Adjustment choices and the final written assessment are self-reviewed.
Start the existing free common-size lesson or try the new free normalization lesson.
1. Put the statements on a comparable basis
Outcome: explain changes in scale, mix and margins without confusing operating performance with financing. Complete F03 accounting and F04 source reconciliation first. Preserve their habits: period, entity, currency, units, version and source location come before a ratio.
Meridian Components is an original fictional industrial business. Its three calendar years and opening balance sheet are supplied in USD millions. Read the source notes before calculating. Expenses are positive, and reported operating expenses include unusual items. Net income includes interest and tax. No acquisition or FX changes enter this historical balance-sheet bridge.
An income-statement common-size column divides each line by revenue. A balance-sheet common-size column normally divides each asset, liability and equity line by total assets. Label the denominator. Neither means dividing every number by whichever total is closest. In 2025, revenue of 1,260 less cost of sales of 781.2 produces gross profit of 478.8 and a 38% gross margin. In 2024, 448 divided by 1,120 was 40%. Revenue rose 12.5%, but cost consumed two additional percentage points of sales.
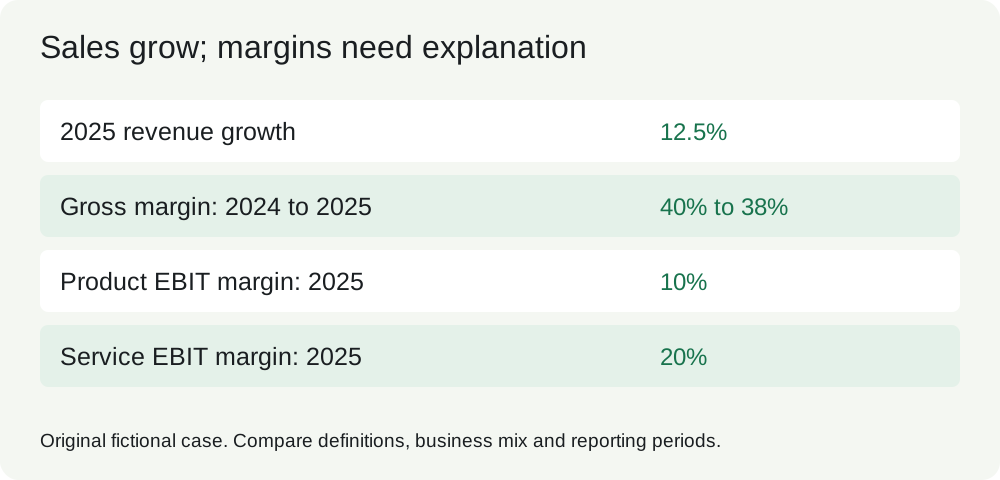
| USD millions except margins | 2023 | 2024 | 2025 |
|---|---|---|---|
| Revenue | 1,000 | 1,120 | 1,260 |
| Gross margin | 40.0% | 40.0% | 38.0% |
| Reported EBIT | 130 | 154 | 145 |
| Reported EBIT margin | 13.0% | 13.75% | 11.51% |
For a trend index, divide each year’s amount by the chosen base and multiply by 100. Revenue’s 2023 index is 100; its 2025 index is 126. Cost of sales reaches 130.2. Growth uses the immediately preceding comparable year, while CAGR uses the number of intervals: (1260/1000)^(1/2)-1 = 12.25%. Three observations contain two annual growth intervals. A zero or negative base needs a different explanation, not a misleading percentage.
Classify operating items before estimating operating returns. Trade receivables, inventory, supplier payables and accrued operating costs belong to operations here. Debt and interest belong to financing; excess cash is excluded from operating invested capital. Cash required to operate a real business may belong in operating capital. Tax on operating income must be distinguished from tax effects of financing. Keep reporting classifications visible when your analytical grouping differs.
Practice: use the existing Common-Size and Trend exercises, which retain their IDs and saved progress. Then calculate Meridian’s 2025 cost-of-sales percentage and explain why revenue growth does not establish better profitability. Check: 62%, versus 60% in 2024. Ask whether input prices, discounting or mix caused the deterioration. The consolidated statement alone cannot answer that question.
2. Connect profit margins to asset efficiency
Outcome: distinguish profitability, efficiency and capital structure. A margin measures profit per unit of sales. A return measures profit relative to capital committed. A large margin can coexist with a weak return if the business needs substantial assets.
Calculate gross profit, EBIT and net income separately. Meridian’s 2025 EBIT is 1260 − 781.2 − 283.8 − 50 = 145. Interest is 28 and tax is 29.25, leaving net income of 87.75. Reported EBITDA is 145 + 50 = 195. This bridge works because this case has no additional nonoperating items beyond interest. For an actual issuer, reconcile from the appropriate reported earnings measure and inspect all intervening lines.
ROA normally compares net income with average assets. ROE compares net income with average common equity, using a numerator matched to that equity claim. Prefer average beginning/end balances when a flow spans a year; seasonal businesses may need monthly averages. End-of-year ratios answer a different question and can be distorted by year-end debt repayment or acquisitions.
The three-step DuPont identity is net margin × asset turnover × equity multiplier: (NI/revenue) × (revenue/average assets) × (average assets/average equity). Denominators cancel to NI/average equity. Higher leverage can improve ROE without improving the operating business, while also increasing risk. Keep negative equity, near-zero profit and unusual gains visible rather than assigning a normal-looking ratio.
ROIC isolates operations from financing. In this case, operating working capital is receivables plus inventory less operating payables and accruals. Add net PP&E to get invested capital. All cash is excess under the supplied convention. The financing-side check is debt plus book equity less cash. Both give 722 for year-end 2025. The prior-year amount is 586, so average invested capital is 654. Use after-tax operating earnings, NOPAT, above this denominator; do not divide net income after interest by an enterprise capital base.
After the explicit adjustments in lesson 5, normalized EBIT is 149 and NOPAT is 149 × 75% = 111.75. Historical normalized ROIC is 111.75/654 = 17.09%. Reported EBIT would give a different disclosed measure. Neither is a contractual covenant definition.
Practice: reuse Profitability and DuPont. Calculate the reported and normalized ROIC difference and trace it to the adjustment log. Check: the normalized uplift is 4 × 75% / 654 = 0.46 percentage points. Ask whether excluding excess cash, using net book assets or accepting the closure add-back makes the business look better. These are economically consequential conventions, not formatting decisions.
3. Reconcile earnings to cash
Outcome: explain where operating cash differs from profit, then separate operating cash from money available after investment. EBITDA is neither operating cash flow nor free cash flow.
Working-capital days match a balance with its generating flow. For Meridian use average receivables/revenue × 365 for DSO, average inventory/cost of sales × 365 for DIO, and average payables/cost of sales × 365 for DPO. Credit sales and purchases are preferable when available and relevant; this pack does not provide them. Cost of sales is the disclosed payable-days proxy. Use the same convention across the comparison and name its limits.
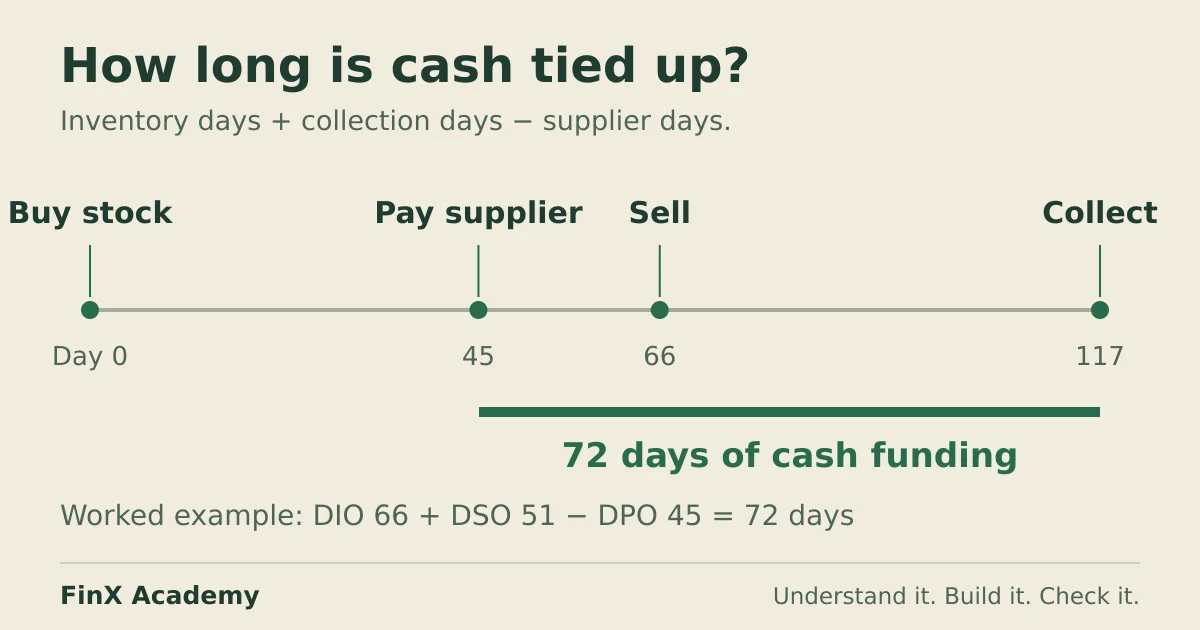
The cash conversion cycle is DSO + DIO − DPO. In 2025, these are 70.83, 81.77 and 58.40 days, giving 94.19 days. The 2023 cycle was 67.22 days. This suggests more cash is tied up in operations. Seasonality, changing credit terms, receivable sales and different product mixes can alter the interpretation. A negative cycle can be normal for a cash retailer funded by suppliers.
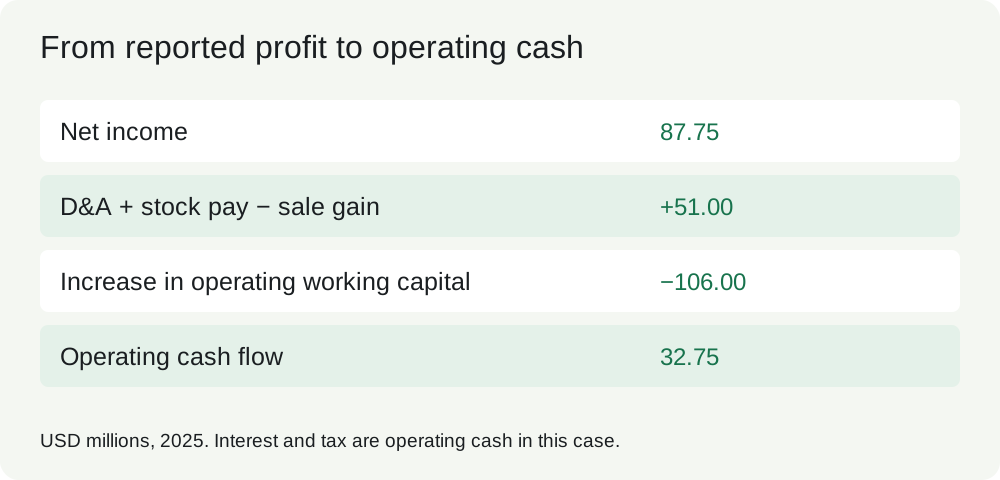
| 2025 indirect CFO bridge, USD millions | Amount |
|---|---|
| Net income | 87.75 |
| Add D&A | 50.00 |
| Add noncash stock compensation | 9.00 |
| Remove asset-sale gain | (8.00) |
| Increase in receivables | (99.00) |
| Increase in inventory | (40.00) |
| Increase in payables | 30.00 |
| Increase in operating accruals | 3.00 |
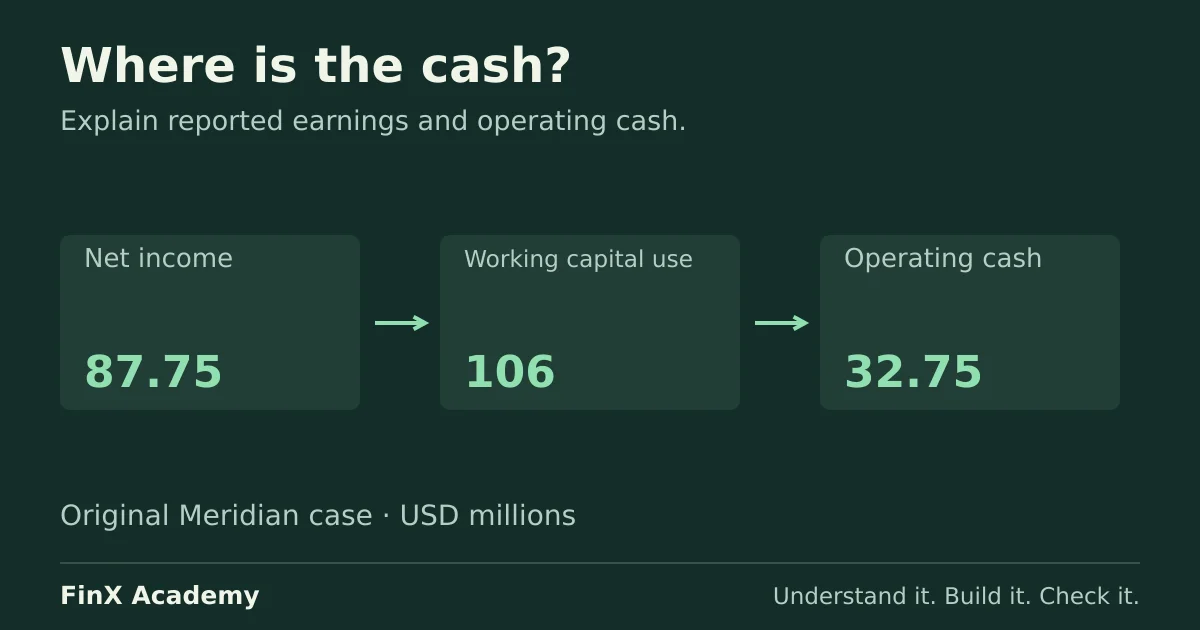
| Operating cash flow | 32.75 |
The aggregate increase in operating working capital is 106. CFO/net income is 37.32%. Subtract cash capex of 90 to obtain the explicitly defined CFO − capex measure of −57.25. This is levered cash after interest and tax under the case classification. It is not unlevered FCFF, and it excludes disposal proceeds. Add net investing cash of −72 and financing cash of +5 to CFO: cash falls 34.25 from 96 to 61.75.
Do not remove the factory closure twice. Reported net income already includes its 12 expense. Nine was paid and three remains in accruals. The ordinary indirect bridge automatically captures that timing. An analyst’s earnings add-back does not reverse a bank payment. To start from normalized net income instead, first reverse the after-tax normalization of 3, then use the reported cash bridge.
Practice: reuse Liquidity and Cash Flow, then solve the final case bridge. Increase 2025 receivables by 10 while keeping earnings fixed. Check: CFO and closing cash fall by 10, and DSO rises. The independent source CFO control stays fixed and exposes the changed-input difference. Restore the source afterward. Weak conversion warrants aging and subsequent-collection evidence; it is not proof of fictitious revenue.
4. Read liquidity and leverage in context
Outcome: distinguish an accounting ratio from the timing and contractual terms of cash obligations. A current ratio cannot establish that receivables will arrive before a debt payment.
Meridian’s 2025 current assets are cash 61.75, receivables 294 and inventory 195. Current operating liabilities are payables 140 and accruals 43. All supplied debt is long-term. The current ratio is 550.75/183 = 3.01x. Excluding inventory gives a quick ratio of 355.75/183 = 1.94x. These appear comfortable, yet cash fell and receivable days increased. Liquidity depends on collectability, inventory saleability, restricted cash, maturity dates and committed facilities. None should be silently inferred from the ratio.
Net debt is debt less the cash eligible for that measure: 280 − 61.75 = 218.25. Using analyst-normalized EBITDA of 199 gives net leverage of 1.10x. Reported EBIT/interest is 145/28 = 5.18x. These ratios use annual flows and year-end debt; a seasonal peak or near-term refinancing can be missed. Negative EBITDA makes ordinary debt/EBITDA interpretation unhelpful. Return an unavailable ratio or clearly labelled exceptional state instead of calling a negative multiple low leverage.
Lease treatment must be consistent. Including lease liabilities in debt while comparing earnings that still deduct all rent differs from a lease-adjusted earnings basis. Asset-light distributors, owned-property retailers and leased retailers can produce different ratios even when their business activities are similar. A definition that is useful for one comparison is not automatically the contractual definition in a loan agreement.
The existing Leverage and Coverage and Northwind covenant case remain part of this course. Northwind teaches agreement-specific EBITDA add-backs, caps, quarterly tests and equity cures. Reuse those exercises rather than recreate their mechanics. For F05, explain why an allowed contractual add-back does not necessarily represent sustainable economic earnings. The Meridian pack contains no loan agreement. Therefore no statement that Meridian complies with a covenant is supported.
Practice: calculate leverage using 199 and using the conservative closure treatment of 187. Check: 1.10x versus 1.17x, before rounding. Both depend on the cash definition. Write the three pieces of evidence you would obtain next: debt maturity and covenant documents, restrictions on cash/facilities, and the collection profile of receivables. An earnings-quality note should describe those gaps even when the current ratio exceeds three.
5. Make defensible earnings adjustments
Outcome: reconcile reported performance to a clearly defined analytical measure, accepting and rejecting adjustments with evidence. Normalization is an analyst judgement, not permission to label every inconvenient cost unusual.
Begin with reported earnings and log each candidate’s amount, sign, period, source, recurrence, cash timing, tax treatment and decision. Apply the same policy to gains and losses and across years. Do not present adjusted results without the reported comparison. The SEC’s non-GAAP interpretations explain why removing ordinary recurring operating costs or changing recognition principles can mislead. This course’s analyst comparison is not a legal compliance opinion.
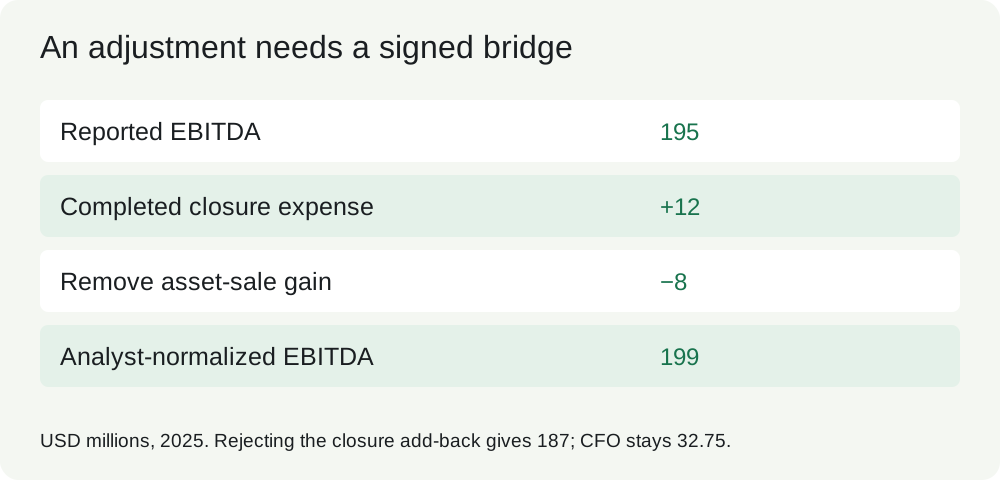
| 2025 candidate, USD millions | Signed effect | Decision |
|---|---|---|
| Completed factory closure | +12 | Accept provisionally under N3; show recurrence sensitivity |
| Asset-sale gain | −8 | Remove with disposal evidence N4 |
| Annual reorganization | +5 | Reject: similar costs recur |
| Stock compensation | +9 | Reject for earnings: recurring employee cost |
| Product-launch marketing | +7 | Reject: supports recurring product replacement |
| Future cost savings | +10 | Reject: not a historical expense |
Reported EBITDA is 195. Accepting the closure and removing the gain gives 195 + 12 − 8 = 199. A management-style proposal adding all five positive candidates would show 238 and retain the gain. The 39 difference comprises rejected add-backs of 31 plus the omitted gain removal of 8. Reconcile this difference explicitly.
The closure choice is ambiguous. A completed site, invoices and a board-approved exit support treating that specific charge separately. The memo also mentions another review without a quantified program. A defensible conservative answer rejects the closure add-back until recurrence is resolved, producing 195 − 8 = 187. Explain the policy, retain the 187–199 sensitivity and request the broader restructuring plan. The exercise’s numerical answer implements a stated decision; it does not prove that decision uniquely correct.
Apply the policy historically. Add back 2023’s closed legacy litigation expense of 4; remove 2024’s related recovery gain of 6. Normalized EBITDA becomes 174, 192 and 199. Growth in 2025 is only 3.65%, despite revenue growth of 12.5%. At the case’s 25% tax assumption, normalized net income is 85.5, 93 and 90.75. Real adjustment tax effects depend on deductibility, jurisdiction, losses and discrete tax items; do not apply a universal tax rate automatically.
Practice: complete all eight decision fields and written rationales in the workbook. Blank is undecided, while zero means rejected. The workbook leaves normalized results unavailable until every decision is explicit. Changing the closure flag to zero reduces 2025 EBITDA by 12 and normalized net income by 9. CFO remains 32.75. Write why noncash stock compensation is added back in the cash bridge yet retained as an economic earnings expense.
6. Explain segment economics and comparability
Outcome: identify which businesses drive results and which differences prevent a fair ratio comparison. Consolidated averages can conceal a weakening segment and an improving mix.
Meridian reports Product revenue of 700, 770 and 840, with EBIT of 91, 96 and 84. Service revenue is 300, 350 and 420, with EBIT of 54, 70 and 84. Corporate costs are 15, 12 and 23. There are no intersegment sales. The 2025 reconciliation is 840 + 420 = 1260 revenue and 84 + 84 − 23 = 145 EBIT. Keep the corporate cost bridge; adding segment profits without it overstates group earnings.
Product’s margin falls from 13% in 2023 to 10% in 2025. Service’s rises from 18% to 20%, and its share of revenue increases from 30% to one-third. In 2025 both segments earn 84 despite Product having twice Service’s revenue. The segment margin before corporate costs is 168/1260 = 13.33%; the group margin after corporate costs is 11.51%. These are different scopes, not contradictory calculations.
A weighted average uses revenue shares: (840/1260 × 10%) + (420/1260 × 20%) = 13.33%. A simple average of 15% ignores segment size. If you allocate corporate costs, state the allocation driver and show unallocated reported results too. The source attributes all unusual adjustment candidates to corporate costs, but does not supply segment D&A, assets or working capital. Segment EBITDA and segment ROIC are therefore unavailable.
Business models change the usefulness of ratios. A subscription company may collect in advance, a manufacturer may finance inventories, and a marketplace may report net commission instead of gross merchandise value. A bank’s funding and interest are central to operations; an industrial-company net-debt/EBITDA template can be inappropriate. Comparability requires the same accounting basis, period, consolidation scope, lease treatment, revenue gross/net treatment, asset age and capitalization policy, with residual differences explained.
Practice: increase Service revenue by 42 while holding its margin at 20% and Product/corporate results fixed in a separate illustration. Check: Service EBIT increases 8.4; consolidated revenue becomes 1,302 and EBIT 153.4. Do not overwrite reported history with this scenario. Explain that a richer service mix can lift the aggregate margin without repairing Product’s economics. Request product price/cost detail and segment investment before claiming a higher-return growth strategy.
7. Decompose growth and its reinvestment needs
Outcome: distinguish reported sales growth from organic growth, and growth from value creation. Always reconcile a bridge to the total and state where interaction effects are allocated.
Use the separate revenue-driver illustration in source note P3. It starts at 1,120 and adds volume 56, price 33.6, price-volume interaction 1.68, mix −7.28, acquisitions 40 and FX 16. The changes sum to 140 and revenue becomes 1,260. Reported growth is 12.5%. Excluding acquisitions and FX leaves organic constant-currency growth of 84/1120 = 7.5%. Price and volume alone cannot explain the full change.
For a single product, revenue equals price times quantity. With a 5% quantity increase and 3% price increase, growth is 1.05 × 1.03 − 1 = 8.15%. The 0.15 percentage-point interaction is real. You can allocate it to price or volume using a stated sequential bridge, but must not count it twice. Multi-product mix needs product-level evidence. The P3 illustration intentionally supplies that evidence separately; its acquisition and FX amounts do not enter Meridian’s historical cash bridge.
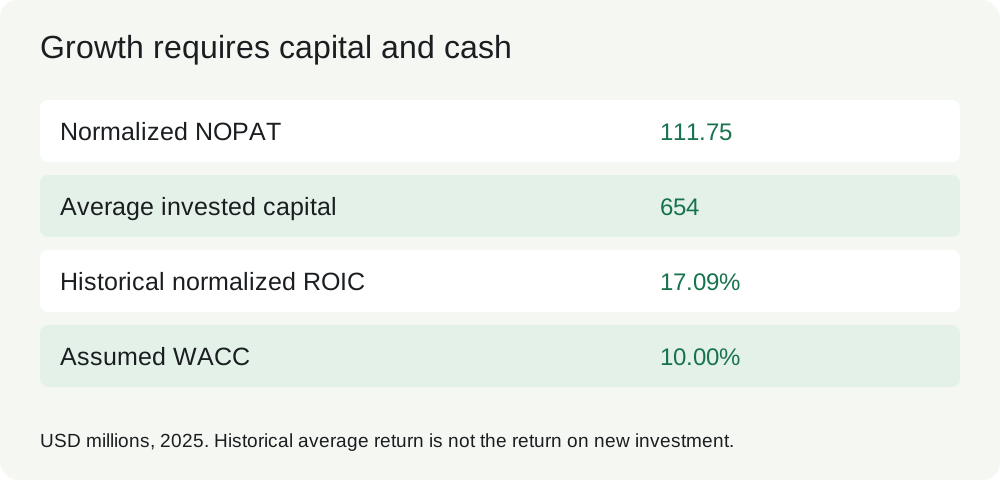
Meridian’s operating working capital rises by 106 in 2025. Cash capex of 90 exceeds D&A of 50, so the stated reinvestment measure is 90 − 50 + 106 = 146. Normalized NOPAT is 111.75. Reinvestment is 130.65% of NOPAT, which can happen during expansion or poor cash collection. A useful unlevered cash illustration is NOPAT less that reinvestment, −34.25, before other noncash, tax and disposal conventions. It is not identical to reported CFO less capex. Name the treatment of stock compensation and actual versus assumed tax before comparing them.
The invested-capital roll-forward also subtracts the disposed asset’s book value of 10: 586 + 146 − 10 = 722. Omitting the disposal produces a false difference. Normalized ROIC falls from 21.85% to 20.63% to 17.09%. With the assumed 10% WACC, 2025 economic profit is 111.75 − 10% × 654 = 46.35. It is positive on this convention but declining from 57.2 in 2024.
Under a steady return on new capital, expected operating-profit growth can be linked to reinvestment rate times incremental return. Historical average ROIC includes old assets and accounting conventions. It is not evidence that new investment will earn that return. If sustainable growth is 6% and incremental ROIC is 15%, the implied reinvestment rate is 40%. At a 10% incremental return, the same growth requires 60%. These are forecast assumptions to test, not observations.
Practice: use the combined Segment economics and returns exercises. Explain why positive economic profit and negative current free cash can coexist. Request maintenance/growth capex and collection evidence before concluding that reinvestment is productive.
8. Investigate policies, red flags and missing evidence
Outcome: explain how recognition, estimates and presentation affect comparisons without turning a warning sign into an accusation. Accounting choices can change profit timing even when current cash is unchanged.
Revenue recognized before collection raises receivables. That can be ordinary credit sales or a problem with recognition or collectability. Examine contract terms, acceptance, returns, receivable aging and subsequent cash. Growing DSO alone does not identify which explanation is true. For Meridian, 2025 receivables rise 99 while revenue rises 140. This is a concrete reason to ask for evidence, not a basis for claiming fraud.
Capitalizing costs moves expense into later amortization and can raise current earnings and operating cash relative to expensing if the cash is classified as investing. A consistent comparison needs the underlying spending, amortization, useful lives and policy. Do not simply add back amortization while ignoring the spending needed to sustain the asset. Inventory costing and write-downs likewise change margins and working-capital balances; reversing a write-down can require analysis of future margins when that inventory sells.
In a separate useful-life illustration, extending an asset’s life lowers current D&A by 6. EBIT rises 6, and net income rises 4.5 at the assumed tax rate. EBITDA does not change. With unchanged current cash tax, the 4.5 net-income effect is offset by the D&A and deferred-tax reconciliation, leaving CFO unchanged. If actual cash tax also falls, cash changes; state which assumption applies. This is a change in estimate illustration, not a correction to Meridian’s supplied history.
Stock compensation raises another distinction: the cash-flow add-back records that an expense did not require current cash, while dilution or replacement cash pay remains an economic cost. Recurring restructuring, frequent adjusted-metric changes, persistent profit/cash divergence, unexplained receivable sales and unusually favorable working-capital cutoffs merit investigation. A one-year cash surge from stretching suppliers may be unsustainable.
IFRS 18 is effective for annual reporting periods beginning on or after 1 January 2027, with earlier application permitted. Check whether a company has adopted it before comparing presentation categories and management-defined measures. This dated note does not assume every October 2026 issuer uses the same presentation. US GAAP and IFRS classifications and sector exceptions also need attention.
Practice: reject an unsupported estimate-based add-back and calculate a transparent sensitivity instead. Keep missing data unavailable, including zero-denominator returns and absent segment assets. In the final note, pair every material uncertainty with a specific request: aging and subsequent receipts; capex by purpose; closure-plan scope and invoices; revenue-policy/contract evidence; debt agreements; and segment capital. Numerical reconciliation confirms arithmetic consistency. It does not resolve these evidence gaps.
9. Deliver a normalized history and earnings-quality assessment
Outcome: produce a reproducible analysis and a short conclusion whose strength matches the evidence. Attempt the workbook before opening the worked answer. This is public teaching practice with a self-review rubric, not an unseen or externally graded assessment.
Deliver three comparable historical years, common-size and growth analysis, an adjustment log, reported-to-normalized earnings bridges, a complete earnings-to-cash reconciliation, working-capital days, segment comparisons, ROIC/reinvestment calculations and a 200–300-word assessment. State the tax, cash, capital and timing conventions. For every candidate, record accepted or rejected, signed amount, evidence, recurrence and cash implications. Explain the alternative closure treatment rather than treating the answer key as the only permissible judgement.
| USD millions | 2023 | 2024 | 2025 |
|---|---|---|---|
| Reported EBITDA | 170 | 198 | 195 |
| Accepted signed adjustments | 4 | (6) | 4 |
| Normalized EBITDA | 174 | 192 | 199 |
| Normalized EBIT | 134 | 148 | 149 |
| Normalized net income | 85.5 | 93.0 | 90.75 |
| Reported operating cash | 98.5 | 82.5 | 32.75 |
| CFO less cash capex | 28.5 | 2.5 | (57.25) |
Worked assessment: Meridian’s sales increased 12.5% in 2025, but gross margin fell from 40% to 38%. Product EBIT margin declined to 10%, while Service maintained 20% and grew its share. Normalized EBITDA rose only 3.65% to 199 and normalized net income fell to 90.75. I accept the documented completed-site closure expense of 12 as a separately identified judgement and remove the disposal gain of 8. I reject recurring reorganization, compensation and launch costs, and exclude unrealized future savings. The earlier litigation cost and recovery are treated symmetrically. Because another site review is mentioned, retaining the closure cost is also defensible; that produces EBITDA of 187.
Operating cash of 32.75 is 37.32% of reported net income. Receivables absorbed 99 and inventory 40, partly funded by payables and accruals of 33. Cash capex of 90 leaves CFO less capex of −57.25; disposal receipts and new debt partly fund the cash deficit. The earnings adjustment does not undo the closure’s cash payments. Normalized ROIC of 17.09% exceeds the assumed 10% WACC, but fell from 20.63%, while reinvestment exceeds NOPAT. These facts support weaker cash conversion and deteriorating returns under the stated conventions. They do not prove aggressive recognition, bad debts, sustainable future growth or covenant compliance. I need receivable aging and subsequent collections, maintenance versus growth capex, the wider closure plan, segment capital and debt terms to resolve those questions.
Changed-input review: add 10 to 2025 receivables, leaving independent source controls fixed. CFO and closing cash fall 10. Reject the closure add-back: normalized EBITDA falls 12, normalized net income falls 9, and reported CFO stays unchanged. Delete a required decision: normalized outputs become unavailable. Restore all trial inputs before handoff.
Self-review rubric: 40% arithmetic and reconciliations; 25% formula robustness and source traceability; 20% defensible decisions and missing-evidence distinction; 15% clear communication. These weights are teaching guidance, not a calibrated certification threshold. A correct number with an unsupported adjustment is incomplete. A sensible alternative policy with a consistent bridge and evidence can be acceptable. The IDE checks specified numerical formulas; written judgement requires self-review or a named human reviewer.
Unfamiliar retry: a prepaid service company has revenue 600, EBIT 72, D&A 18, interest 6 and a 25% tax rate. A one-time gain of 9 is included in EBIT; an ordinary annual retention campaign costs 12. Receivables increase 5, inventory is zero, customer advances increase 20, and capex is 22. No other changes. Remove the gain but retain the campaign. Check after attempting: normalized EBITDA 81; reported net income 49.5; CFO 49.5 + 18 − 9 − 5 + 20 = 73.5; CFO less capex 51.5. Explain why advance collections improve current cash without establishing future profitability or permission to recognize revenue early.
Sources and next practice
Original fictional teaching pack, frozen 9 October 2026. All money is USD millions. Calendar years end December 31. Historical statements are already on a consistent reporting basis. This is a financial analysis case, not a real issuer filing or investment recommendation.
S1 supplies three years of consolidated results and 2022 opening balances. Expenses are positive. Operating expenses exclude D&A but include stock compensation, unusual expenses and gains netted against expense. Tax is 25% of pretax profit in this deliberately simplified profitable-company case. Interest and income tax are paid in operating cash. There is no deferred tax, tax payable, debt current portion, lease, pension, goodwill or other balance-sheet account. All cash is excess for the case’s ROIC convention. Real companies need a justified operating-cash allocation. Debt is long-term. Book equity receives both retained profit and stock compensation. Do not interpret these simplifying choices as reporting rules.
S2 records N1–N8 in adjustments.csv. The full amount of each listed expense/gain is already in reported EBIT except future savings, which is a target only. Adding savings to history creates income that was never earned. The 2024 recovery is explicitly shown in investing cash in this synthetic source; the indirect bridge removes it from operating cash. Investigate classification when adapting to a real issuer.
P1. Segment memo: Product and Service sell to external customers only. No intersegment eliminations. Segment EBIT excludes central corporate costs. D&A, assets and working capital by segment are not supplied. Compare segment EBIT margins, but do not invent segment EBITDA or ROIC. All adjustment candidates sit in corporate costs for this case.
P2. Policy memo: no accounting-policy change is embedded in the three historical years. A separate transfer exercise assumes a useful-life extension lowers current D&A by 6 with no cash effect. It tests sensitivity, not a correction to the history. No customer aging, subsequent collections, maintenance capex split or covenant agreement is supplied. These remain diligence questions.
P3. Independent revenue-bridge illustration: prior revenue 1,120; volume +56 at old price; price +33.6 on old volume; price-volume interaction +1.68; mix −7.28; acquired sales +40; FX +16; current revenue 1,260. This illustration teaches definitions and exact reconciliation. Acquisition/FX amounts are not inserted into Meridian’s balance-sheet cash bridge, which explicitly has neither. Organic constant-currency growth for the illustration excludes acquired sales and FX.
P4. Investment convention: NOPAT uses normalized EBIT at the stated tax rate; invested capital is noncash operating working capital plus net PP&E, equivalent here to debt plus equity less cash. Use average beginning/end invested capital for historical ROIC. Compare with an assumed 10% nominal USD after-tax WACC for teaching. This is not a market estimate. Historical average ROIC does not establish incremental returns or forecast growth.
Primary conceptual references checked 9 October 2026: SEC non-GAAP interpretations, IFRS 18, Damodaran growth determinants. Sources inform definitions; every case number and question is original.
Continue with guided practice
Read the complete free F05 course, then practise common-size statements and defensible earnings adjustments before the Meridian case.
Financial Statement Analysis course